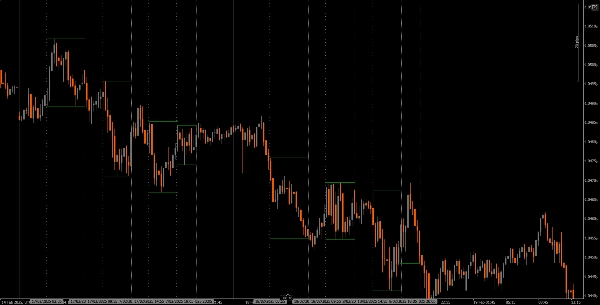
它允许用户标记主要交易时段——亚洲、伦敦、纽约和伦敦收盘的开盘和收盘时间,并可自定义颜色、样式和粗细。该指标为每个时段绘制高点和低点趋势线,提供市场行为的洞察。通过用户友好的拖放(+Alt键)功能,使绘制时段高点和低点变得快捷。无论是新手还是有经验的交易者,这个指标都能帮助更轻松地应对不同市场时段的复杂性。
功能
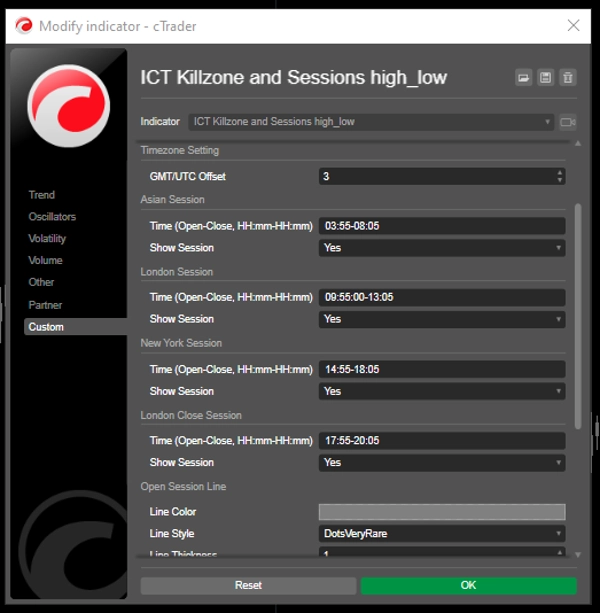
可自定义的时段时间:用户可以定义主要交易时段(亚洲、伦敦、纽约和伦敦收盘)的开盘和收盘时间,实现符合其交易策略的个性化可视化。
动态垂直线:指标在时段开盘和收盘时间绘制垂直线,方便一目了然地识别关键市场事件。
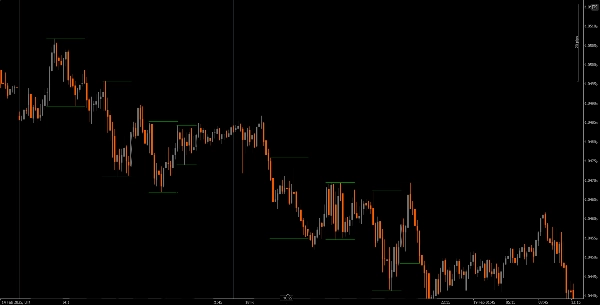
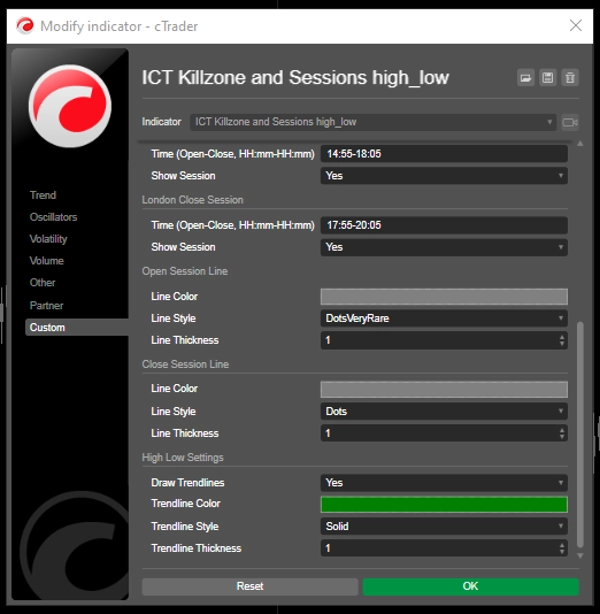
趋势线可视化:它可以自动为每个时段绘制高点和低点趋势线,帮助交易者根据时段价格行为观察潜在的支撑和阻力位。
用户友好的拖放(+Alt键):拖放(+Alt键)功能使交易者能够轻松选择特定时间范围进行分析,提升整体用户体验。
时段标签:显示时段趋势线旁的标签选项,增加清晰度,帮助交易者快速识别正在分析的时段。
时区调整:用户可以设置GMT/UTC偏移,确保时段时间根据其本地时区准确显示。
教程
安装:在您的cAlgo平台上下载并安装The ICT Killzone and Sessions high_low指标。
设置:打开设置,根据您的偏好自定义时段时间、颜色、线条样式和粗细。
使用指标:在图表上点击并拖动(+ Alt键)创建一个包含您想分析时间范围的矩形。指标将自动绘制指定时段的垂直线和趋势线。
分析:在交易时观察时段线和趋势线。利用这些信息识别基于时段动态的潜在支撑和阻力位。
推荐配套工具
cTrader:cAlgo的原生平台,提供无缝的指标使用和自定义体验。
市场分析工具:将此指标与移动平均线或振荡器等市场分析工具结合使用,提升您的交易策略。
风险管理工具:使用仓位大小计算器和止损工具,有效管理交易风险。
通过将The ICT Killzone and Sessions high_low指标与这些工具集成,交易者可以提升市场分析能力,提高在不同交易时段复杂环境中取得成功的机会。
5 | 40 % | |
4 | 20 % | |
3 | 0 % | |
2 | 0 % | |
1 | 40 % |