
说明
*不同资产类别的开盘时间将有所不同
*默认时间值适用于NQ/ES/YM(期货)
*时间值应为东部标准时间(EST)
主要特点:
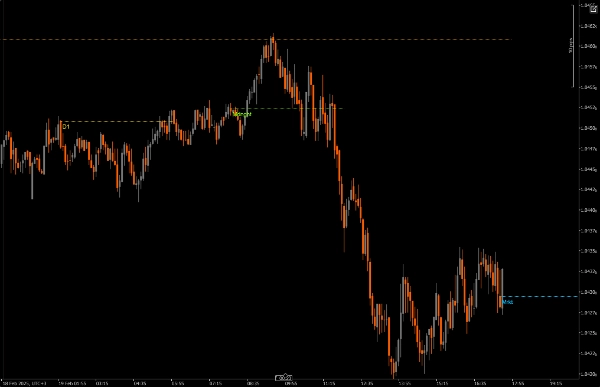
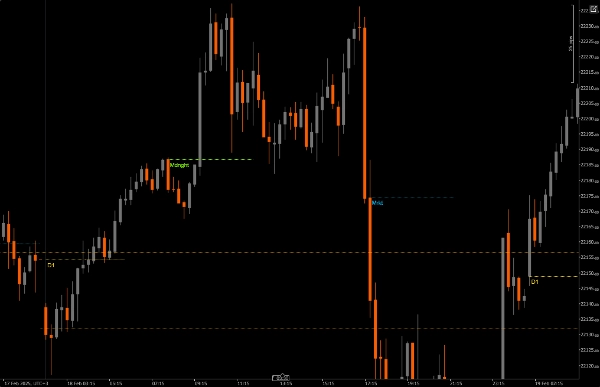
基于时间的价格水平
在关键市场时间的开盘价处绘制开盘价线
所有时间均同步为东部标准时间(EST)
每个时间段均采用颜色编码,便于识别
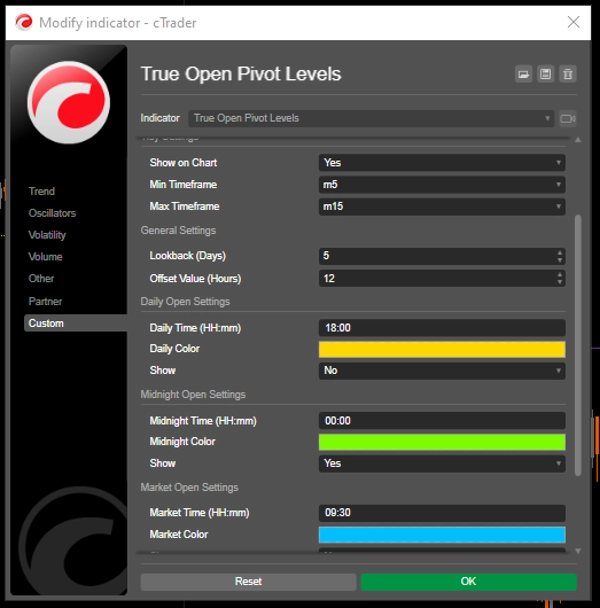
3个可自定义的会话标记:
每日开盘(东部时间凌晨12:00)- 默认金色
午夜开盘(东部时间凌晨4:00)- 默认绿色
市场开盘(东部时间上午9:30)- 默认蓝色
每个会话可独立开关
视觉自定义:
可调节线条粗细
多种线条样式(实线、点线、虚线)
每个会话的颜色可自定义
可选时间标签显示EST时间
线条偏移可配置,最长可达48小时
灵活的时间框架支持:
设置显示的最小和最大时间框架
防止在不适合的时间框架上图表混乱
针对M5-M15时间框架进行了优化
时间设置:
所有时间均为EST
自定义会话时间以匹配您的交易策略
根据您的分析需求调整线条持续时间
视觉设置:
调整线条粗细以提高可见性
根据图表清晰度选择线条样式
根据需要启用/禁用标签
自定义颜色以匹配您的图表主题
通用设置:
定义最小/最大时间框架
调整线条持续时间以进行扩展分析
最佳实践:
从默认设置开始,根据需要进行调整
为每个会话使用不同颜色以便清晰区分
考虑在较低时间框架上减少线条持续时间以防止混乱
初始启用标签以了解时间,图表过于繁忙时可禁用
将指标时间框架设置与您的交易时间框架匹配
此指标特别适用于:
专注于美国市场的日内交易者
需要跟踪会话开盘的交易者
围绕重大市场事件交易的交易者
分析多会话价格行为的交易者
需要清晰视觉参考EST市场时间的任何人
摘要
指标配置
客户评价
5.0
评价:1
5 | 100 % | |
4 | 0 % | |
3 | 0 % | |
2 | 0 % | |
1 | 0 % |
客户评价
March 5, 2025
most of the value comes from the setup needs less second guessing, and H1 makes the signal less noisy.
讨论
常见问答
Commodities
XAUUSD
cTrader Store 提供的所有产品,包括交易机器人、指标和插件,均由第三方开发者提供,仅供信息参考和技术访问之用。cTrader Store 并非经纪商,不提供投资建议、个人推荐或任何未来业绩保证。
该作者的其他作品


猜您喜欢


价格
15
销售
4.63K
免费安装