
Descripción
Objetivo Principal:
Mapear la distribución del volumen por nivel de precio para identificar:
Áreas de alta liquidez
Áreas de baja liquidez
Desequilibrios entre compradores y vendedores
¡Este indicador es poderoso para entender la estructura del mercado e identificar áreas de alta probabilidad para operaciones! 🎯
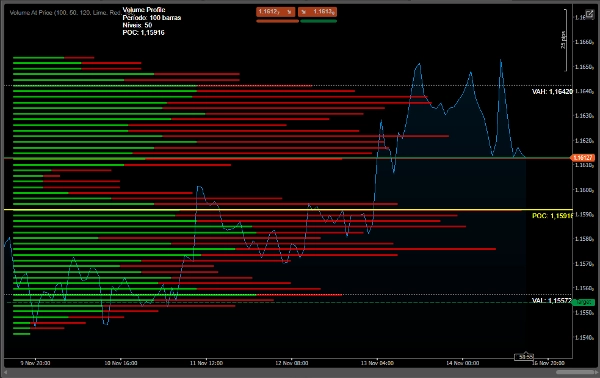
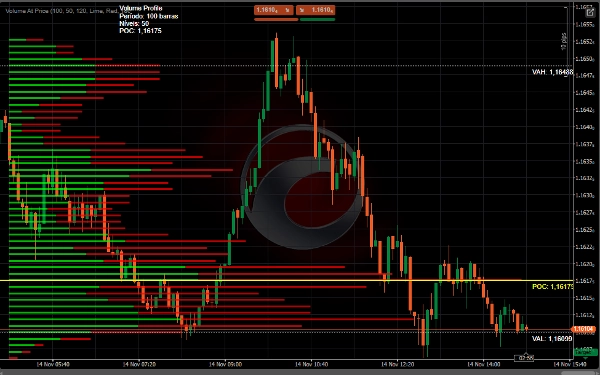
1. POC (Punto de Control)
Linha Amarela - Precio con mayor volumen negociado
Área de mayor liquidez y precio
Soporte/resistencia natural
2. Área de Valor
Líneas blancas - Área donde se negoció el 70% del volumen
VAH (Valor Alto del Área) - Límite superior
VAL (Valor Bajo del Área) - Límite inferior
Zona de equilibrio del mercado
3. Núcleos de Volumen
🟢 Verde - Volumen de compra dominante
🔴 Vermelho - Volumen de venta dominante
Longitud de la barra = Intensidad del volumen
📊 Estrategias de uso
1. Identificación de Soportes y Resistencias
• POC funciona como soporte/resistencia dinámico
• Área de Valor define zona de equilibrio
• Bordes importantes del perfil S/R
2. Análisis de Ruptura
• Ruptura por encima del VAH → Tendencia alcista
• Ruptura por debajo del VAL → Tendencia bajista
• Volumen sin ruptura confirma movimiento
3. Puntos de Entrada
• Compra: Retestea el VAL con volumen comprador
• Venta: Retestea el VAH con volumen vendedor
• Fade: Operar contra los extremos del perfil
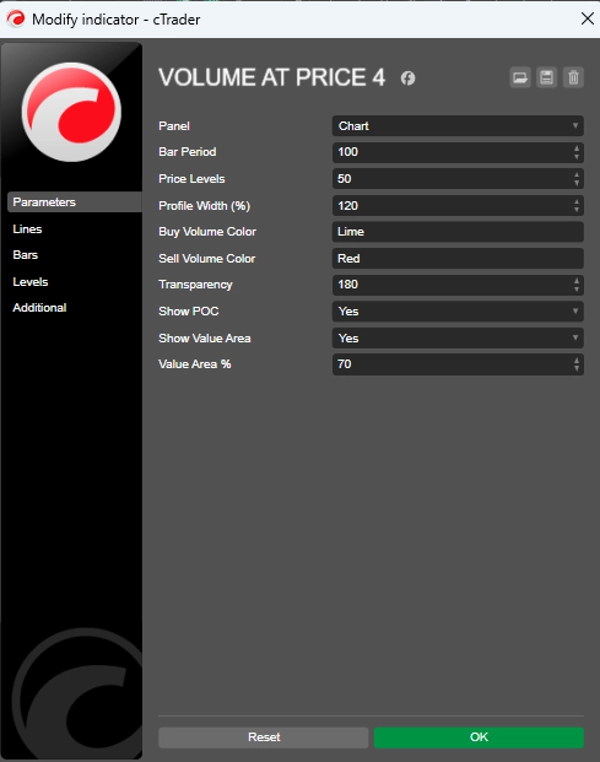
⚙️ Configuraciones recomendadas
Para Day Trading
csharp
Periodo = 50-100
Niveles de Precio = 50
Ancho del Perfil = 120%
% Área de Valor = 70
Para Swing Trading
csharp
Periodo = 100-200
Niveles de Precio = 80
Ancho del Perfil = 150%
% Área de Valor = 70
✅ VENTAJAS:
Identifica soportes/resistencias dinámicos
Muestra la intención del mercado (volumen)
Revela áreas importantes de liquidez
Visualización clara de desequilibrios
Contagem current volume ticks
Resumen
- Point of Control (POC): The price level with the highest traded volume, acting as a dynamic support or resistance.
- Value Area: The price range where 70% of volume is traded, defined by Value Area High (VAH) and Value Area Low (VAL), representing market balance zones.
- Volume Cores: Colored bars indicating dominant buying (green) or selling (red) volume, with bar length reflecting volume intensity.
The indicator supports strategies like identifying support and resistance levels, breakout analysis (trend direction based on VAH and VAL breaks), and entry points (buy near VAL with buyer volume, sell near VAH with seller volume, or fade at profile extremes).
Recommended settings vary by trading style: for day trading, shorter periods and narrower profiles; for swing trading, longer periods and wider profiles. This tool aids in visualizing liquidity, market intent, and volume imbalances to inform trading decisions.
Valoraciones de clientes
5 | 0 % | |
4 | 50 % | |
3 | 50 % | |
2 | 0 % | |
1 | 0 % |


