
Opis
1. Czym jest Hyper Trend i dla kogo jest przeznaczony
Hyper Trend to wskaźnik nakładkowy podążający za trendem dla cTrader. Dostarcza pojedynczą, łatwą do odczytania linię trendu podążającą za ceną, strefę odniesienia do dołączenia do tego trendu, wyraźne znaczniki sygnałów, opcjonalne ramki stop-loss / take-profit na wykresie oraz interaktywny panel, dzięki któremu możesz na żywo dostosować większość widocznych elementów bez ponownego otwierania ustawień.
Cel projektowy jest celowo prosty: wykorzystać dobrze ugruntowane metody handlowe i generować trendy oraz sygnały, które są naprawdę łatwe do odczytania — a następnie uczynić cały wskaźnik lekkim, nieinwazyjnym i szybkim w konfiguracji.
Nadaje się dla każdego rodzaju tradera, niezależnie od doświadczenia.
-
-
- Początkujący otrzymują czysty odczyt kierunku i ryzyka.
- Doświadczeni traderzy otrzymują szybki, konfigurowalny nakładkowy wskaźnik, który nie przeszkadza w ich własnej analizie cen.
-
Został zaprojektowany tak, aby był prosty i efektywny na powierzchni, a jednocześnie oparty na badanych zastosowaniach pod spodem, oraz łatwy do skonfigurowania i dostrojenia.
"Cokolwiek handlujesz i bez względu na doświadczenie, Hyper Trend ma być łatwy do odczytania, łatwy do ustawienia i łatwy do dostrojenia."
2. Idea stojąca za nim
Średnie kroczące, ATR, Super Trend, filtry wygładzające — to są znane, ugruntowane
metody, które istnieją dokładnie po to, by robić to, co Hyper Trend robi: przekształcać surową cenę w czytelny
trend z użytecznymi sygnałami.
Dlaczego więc kolejny wskaźnik? Bo w praktyce większość wskaźników w tej dziedzinie ma te same
problemy:
-
-
- Przepakowywanie. Duża część publikowanych wskaźników to ta sama lub stara logika, przemianowana i
wielokrotnie wydawana na nowo, z niewieloma naprawdę nowymi elementami pod spodem. - Zagracenie wykresu. Wiele z nich nakłada na wykres tyle elementów, że czytanie samej ceny staje się prawie
niemożliwe, a ich wewnętrzna logika czasem działa przeciwko faktycznym
intencjom tradera. - Zanikająca przewaga. Podstawowe koncepcje brzmią dobrze, ale w dzisiejszych szybko rozwijających się
rynkach — szczególnie na szybszych interwałach — często tracą realną przewagę.
- Przepakowywanie. Duża część publikowanych wskaźników to ta sama lub stara logika, przemianowana i
-
Hyper Trend stawia opór wszystkim trzem problemom. Zachowuje ugruntowany szkielet (wygładzanie,
pasy zmienności, kierunek w stylu Super Trend), ale stosuje nowsze podejścia do przetwarzania danych
wstępnego przetwarzania, wygładzania cen i obsługi sygnałów — techniki omawiane
w pracach naukowych, czasopismach handlowych i badaniach akademickich. Wszystkie linki do źródeł można znaleźć w opisie wideo.
REFERENCJE ŹRÓDŁOWE
- ECB: FILTR CYKLU TRENDU(-SEZONU)
- Filtr Kalmana od podstaw: od intuicji do probabilistycznego modelu graficznego do rzeczywistego przypadku na rynkach finansowych
- Modele wyceny finansowej w czasie ciągłym i filtracja Kalmana
- Filtr Holt-Winters i jednostronny filtr HP: bliskie powiązanie
- Bayesowska rama do dekompozycji trendu i sezonowości
- Zwroty funduszy hedgingowych, filtr Kalmana i błędy w zmiennych
- Średnie kroczące do wygładzania danych finansowych
- Optymalizacja wydajności strategii fraktalnej adaptacyjnej średniej kroczącej: przypadek EUR/USD
- Filtr Kalmana i optymalne wygładzanie wyprowadzone z modelu regresji
Celem jest praktyczne przetestowanie prostego pytania: czy te teoretyczne koncepcje,
stosowane na bazie ugruntowanych narzędzi, mogą przywrócić realną przewagę na korzyść tradera? Hyper Trend jest
konkretnym przykładem takiego podejścia — ugruntowane metody, zmodernizowane tam, gdzie to ważne, z
czytelnością traktowaną jako cechę pierwszorzędną, a nie dodatek.
"Te same zaufane fundamenty — uśrednianie, zmienność, logika trendu — ale z
nowoczesnym wstępnym przetwarzaniem i nieustannym skupieniem na utrzymaniu czytelności wykresu."
3. Kluczowe punkty — co go wyróżnia
Nakładka nieinwazyjna z założenia. Utrzymuje świadomą równowagę między pokazywaniem tego, co naprawdę użyteczne na cenie a niezakłócaniem przepływu ceny, którą analizujesz.
Optymalizowany dla cTrader — szybki i lekki. Został zaprojektowany pod kątem szybkiego ładowania i niskiego zużycia CPU oraz tak, aby działał płynnie nawet z wieloma instancjami uruchomionymi jednocześnie, na kilku wykresach lub symbolach, dzięki czemu Twoja platforma pozostaje responsywna.
Czysty proces pod maską.
-
-
- Wybierz źródło ceny. Wybierasz, na której cenie ma być wykonane obliczenie — zamknięcie,
punkt środkowy jak HL2, cena typowa jak HLC3 itd. (ustawienie źródła). - Opcjonalne wstępne przetwarzanie. Możesz przepuścić tę cenę przez świece Heikin-Ashi
i/lub filtr Kalmana przed dalszymi krokami, aby wygładzić szumy — to część
koncepcji "zmodernizowanego przetwarzania". - Wygładzona podstawa trendu. Wybrane źródło jest wygładzane, tworząc podstawę trendu, na której opiera się reszta
logiki — zaprojektowaną do śledzenia dominującego ruchu. - Pasy zmienności. Wygładzony przez Wildera ATR ustawia pasy powyżej i poniżej tej podstawy.
- Logika SuperTrend. Standardowa "przyczepność" SuperTrend decyduje, która strona jest aktywna:
w trendzie wzrostowym dolny pas staje się linią podążającą; w trendzie spadkowym górny pas
pełni tę rolę. Gdy cena zamyka się przez aktywny pas, trend się odwraca.
- Wybierz źródło ceny. Wybierasz, na której cenie ma być wykonane obliczenie — zamknięcie,
-
"Został zaprojektowany tak, aby lekko leżeć na wykresie — pokazywać to, co pomaga, ukrywać to, co
nie pomaga, i nigdy nie przeszkadzać samej cenie. Jeden klik na panelu przywraca czystą cenę, kiedy tylko chcesz."
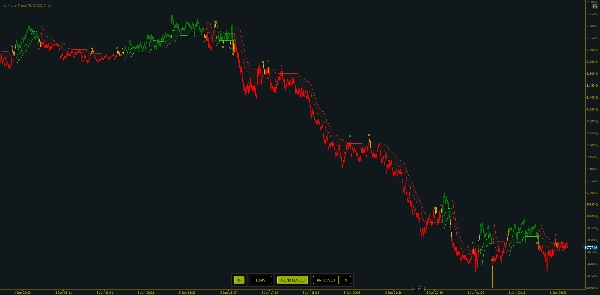
4. Odczyt wykresu — podstawowe elementy wizualne
1. Linia podążająca
-
- Zielony = trend wzrostowy (linia pod ceną)
- Czerwony = trend spadkowy (linia nad ceną)
- Zmiana koloru to zmiana trendu
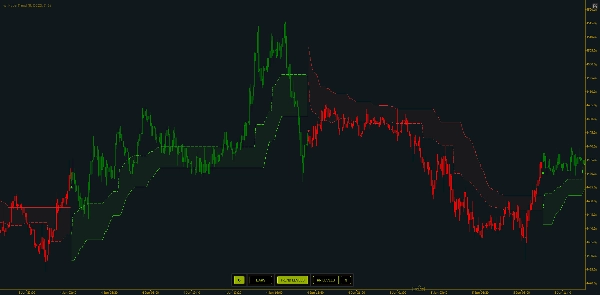
2. Strefy wejścia
-
- Po włączeniu, przerywana linia znajduje się w niewielkiej odległości od linii podążającej w kierunku przeciwnego pasa — to odniesienie "cofnięcia do wartości" wewnątrz aktualnego trendu, zamiast gonienia za ekstremum.
Entry Zone Distancekontroluje, jak daleko ta linia się znajduje.
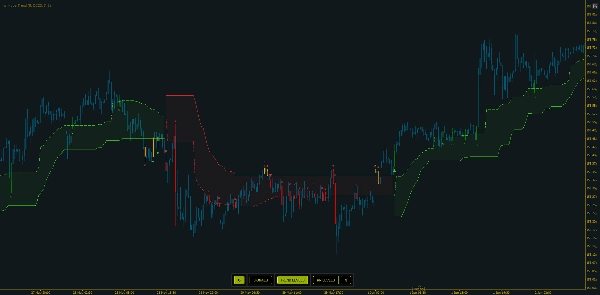
3. Kolorowanie słupków
-
- Słupki mogą być kolorowane na podstawie aktywnego kierunku, w trzech stylach:
-
- Standardowy (byk/niedźwiedź według kierunku),
- Tryb 1, zapewnia inną wizualizację w fazach przejściowych
- Tryb 2, który dodatkowo oznacza neutralne słupki przejściowe.
Widoczna zielono/czerwona linia podążająca to ostateczny wynik. Wszystko inne — strefy wejścia, znaczniki, linie SL/TP, kolorowanie słupków — jest nakładane na ten sam stan kierunku.
"Kolor linii to Twój bias reżimu na pierwszy rzut oka; przerywana strefa to miejsce, gdzie trend oferuje rozsądniejsze wejście."
5. Sygnały i alerty
Hyper Trend rozróżnia trzy typy sygnałów. Każdy sygnał drukuje oznaczony znacznik na potwierdzonym słupku i można go niezależnie włączać/wyłączać:
-
- Sygnały przełączenia (domyślnie włączone) — wyzwalane, gdy trend zmienia kierunek (lub bias). To podstawowy sygnał.
- Sygnały wejścia krzyżowego — wyzwalane na potwierdzonym przejściu tam i z powrotem przez strefę wejścia w istniejącym trendzie (cena opuszcza i odzyskuje strefę). Do wyznaczania momentów wejścia po cofnięciu.
- Sygnały krzyżowania trendu — wyzwalane na potwierdzonym przejściu tam i z powrotem przez samą linię podążającą. W bogatszym trybie kolorowania, krzyżowanie linii trendu na słupku przejściowym/neutralnym traktowane jest jako znacznik wyjścia, a nie nowego wejścia.
- Sygnały wyjścia — widoczne, gdy włączony jest Bar Coloring - Tryb 2, te sygnały pomagają wskazać, kiedy trend traci siłę, pojawiają się na kilka słupków przed sygnałami przełączenia. Są przydatne do wykrywania okresów niskiej zmienności z mniejszym udziałem rynku, które generują ruchy siekane lub w zakresie.
Alerty: po włączeniu Hyper Trend odtwarza wybrany dźwięk i pokazuje wyskakujące okienko dla każdego wykrytego sygnału. Alerty podążają za tymi samymi przełącznikami — tylko typy sygnałów, które włączyłeś, będą generować alerty — a przycisk alertu na panelu na wykresie umożliwia ich włączanie/wyłączanie na żywo. Okienko jest zwięzłe: symbol i interwał czasowy, typ sygnału i kierunek oraz aktualna cena.
"Zacznij od samego sygnału przełączenia dla czystego wykresu, potem dodaj sygnały krzyżowe, gdy chcesz dokładniejszego timingu wejścia. Każdy z nich może powiadomić Cię dźwiękiem i wyskakującym okienkiem."
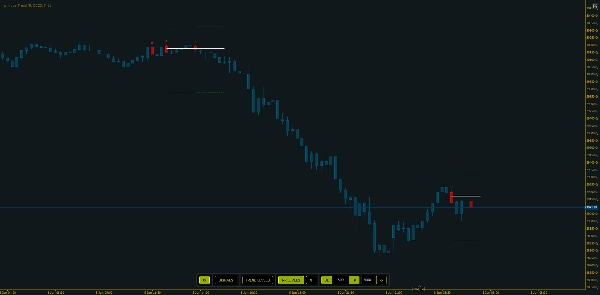
6. Planowanie transakcji — poziomy ryzyka / zysku na wykresie
Po włączeniu poziomów Stoploss / Target, każdy słupek sygnału otrzymuje trzy krótkie linie poziome: linię wejścia na środkowej cenie słupka sygnału, linię SL w stałej odległości pipów po stronie stratnej oraz linię TP w stałej odległości pipów po stronie zyskownej.
Poziomy są wstępnie rozszerzone o stałą liczbę słupków i nie rosną dalej — to migawka w momencie sygnału. Nowy sygnał obcina poprzedni zestaw, aby poziomy się nie nakładały. Wejście, SL i TP mają własne kolory oraz regulowane szerokości i style linii.
"Wizualnie ramuje transakcję — wejście, stop, cel — dzięki czemu widzisz ryzyko i zysk przed zaangażowaniem, a wykres pozostaje przejrzysty dzięki ograniczeniu liczby aktywnych zestawów."
7. Panel interaktywny — zmieniaj wizualizacje na żywo
Panel na wykresie zmienia wyświetlane elementy natychmiastowo, bez ponownego otwierania parametrów.
Aktywne przełączniki są podświetlone; panel zawsze odzwierciedla aktualny stan. Masz wiele opcji umieszczenia go na wykresie lub całkowitego ukrycia.
"Wszystko, co normalnie wymagałoby zagłębienia się w ustawienia — kolorowanie, poziomy trendu, linie ryzyka i odległości SL/TP — jest dostępne jednym kliknięciem na panelu. Wpisz nowe odległości, odśwież i poziomy się zaktualizują."
8. Podejścia handlowe — kilka przykładów
Podejście A — Handluj przełączeniem (podążanie za trendem). Używaj sygnałów przełączenia jako głównej wskazówki: wchodź w nowym kierunku po potwierdzonym odwróceniu i traktuj linię podążającą jako wizualne unieważnienie. Odwrócenie do przeciwnego koloru to wyjście/odwrócenie. Najprostszy, najczystszy odczyt.
Podejście B — Wejście po cofnięciu wewnątrz trendu. Gdy trend jest już ustalony, czekaj, aż cena cofnie się do strefy wejścia i włącz sygnały wejścia krzyżowego, aby ponowne przekroczenie oznaczało moment odzyskania strefy przez cenę — dołącz do trendu po lepszej wartości zamiast gonić za ekstremum.
Podejście C — Ramowanie ryzyka przy każdej konfiguracji. Włącz poziomy RR, ustaw odległości SL / TP odpowiadające zmienności symbolu. Widzisz wejście / stop / cel przed zaangażowaniem i zarządzasz transakcją odpowiednio.
We wszystkich trzech wspólnym mianownikiem jest osąd: działaj w kierunku trendu, potwierdzaj otoczeniem ceny i używaj linii jako odniesienia — Hyper Trend to odczyt, Ty ustawiasz i zarządzasz transakcją.
"Handluj odwróceniem, albo czekaj na cofnięcie do strefy, albo ramuj każdą konfigurację liniami ryzyka — wybierz podejście, które pasuje do Twojego stylu. Zrozum kontekst rynku i łącz go z innymi narzędziami jak RSI czy MACD, dostrzegaj dywergencje. To połączenie przynosi efekty."
9. Jak go ocenić
Praktyczne testy: przewiń historię i sprawdź, czy linia trendu trzymała Cię po właściwej stronie trwałych ruchów i gdzie skupiały się odwrócenia; porównaj dwa ustawienia obok siebie (np. różny mnożnik ATR lub okres trendu), aby zobaczyć kompromis między szybkością reakcji a wygładzeniem; przejrzyj ramki SL/TP historycznie, aby ocenić, jak często cel był osiągany przed stopem przy wybranych odległościach; dopasuj go do rynku (wyraźnie trendujący vs. ściśle zakresowy); oraz zwróć uwagę na czas — identyfikuje najlepsze rejony, gdy rynek faktycznie się porusza, więc porównaj godziny aktywne z cichymi, poza szczytem.
"Oceń go, przewijając historię i porównując ustawienia — jak czyste są odwrócenia, jak dobrze strefa wejścia czasuje cofnięcia i jak rozwiązują się ramki SL/TP?"
10. Ograniczenia i inne uwagi
Hyper Trend jest zbudowany tak, aby być lepszy niż ogólne, przepakowane wskaźniki — ale to narzędzie, nie kula kryształowa:
-
- Może nadal generować fałszywe sygnały. Mechaniczne działanie na każdy sygnał nie przyniesie pozytywnych rezultatów samodzielnie.
- Nagradza umiejętności i kontekst. Zakłada podstawową zdolność czytania ceny i świadomość otoczenia rynku. W połączeniu z tym kontekstem i solidnym zarządzaniem kapitałem staje się naprawdę potężnym narzędziem — i to połączenie zwykle przynosi pozytywne wyniki w dłuższym terminie.
- Najlepiej działa, gdy rynek się porusza. Odczyty z cichych okresów lub całkowicie poza regularnymi godzinami handlu tracą na jakości.
- Narzędzia trendowe mają opóźnienia i fałszywe sygnały. Jak każdy wskaźnik w stylu SuperTrend, odwrócenia mogą pojawiać się z opóźnieniem i skupiać się w zakresach; wygładzanie i pasy ATR to redukują, ale nie eliminują.
- Linie SL/TP to pomoc w planowaniu, nie gwarancja. Stałe odległości pipów od środka słupka sygnału; nie uwzględniają spreadu, poślizgu ani faktycznego wypełnienia i nie podążają za ceną.
"Dodaj podstawową umiejętność czytania ceny, kontekst rynku i zarządzanie kapitałem, a stanie się naprawdę potężny na dłuższą metę — najsilniejszy, gdy rynek się porusza."
HyperTrend dostarczony jako czysta, nieinwazyjna nakładka z wbudowanym timingiem wejścia, wyraźnymi sygnałami, ramowaniem ryzyka na wykresie i panelem sterowania na żywo. Prosty w użyciu, lekki dla cTrader i przeznaczony dla każdego tradera, na dowolnym symbolu i interwale czasowym.
"Prosty w konfiguracji, lekki w działaniu i stworzony, by pomóc każdemu traderowi czytać trend, wspierać wejścia i wyjścia oraz ramować ryzyko — utrzymany czysty i czytelny."
Podsumowanie
Under the hood, HyperTrend processes price data through selectable sources and optional smoothing filters such as Heikin-Ashi and Kalman filters. It applies volatility bands based on ATR and SuperTrend logic to determine active trend direction. The indicator offers three types of signals—trend switches, entry zone crosses, and trailing line crosses—with labeled markers and optional alerts via sound and popups.
Risk management is supported through on-chart stop-loss and take-profit levels displayed as horizontal lines at fixed pip distances from entry points, helping traders visualize risk/reward before committing. An interactive on-chart panel allows live adjustment of visual settings and parameters without reopening menus.
HyperTrend is optimized for fast, low-CPU performance on cTrader, suitable for all trader experience levels, and applicable across symbols and timeframes. It emphasizes readability and simplicity while incorporating modern data processing techniques to enhance traditional trend-following methods.


