present
Sign up and get $50 off your first purchase
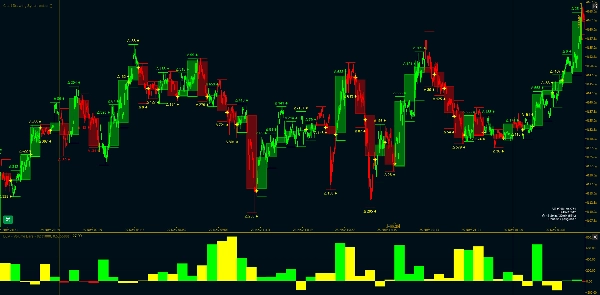
Trading product for WT - Tick Volume Bars Indicator Forex Signal, image 1
WT - Tick Volume Bars
Indicator
1 purchases
Version 1.0, Nov 2025
Windows, Mac
5.0
Reviews: 1
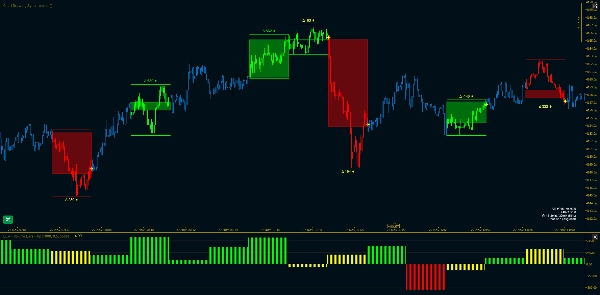
Trading product for WT - Tick Volume Bars Indicator Forex Signal, image 2
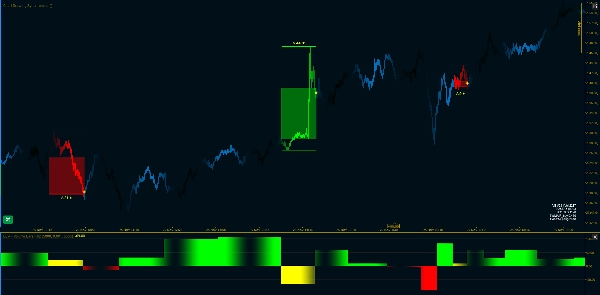
Trading product for WT - Tick Volume Bars Indicator Forex Signal, image 3
Trading product for WT - Tick Volume Bars Indicator Forex Signal, image 4
98.17M
Traded volume
147.13K
Pips won
89
Sales
523
Free installs

Description

Tick Volume Bars is an information-driven bar sampling method that creates bars based on cumulative volume reaching an adaptive threshold. Unlike time-based bars, Volume Bars adjust to market activity levels using real-time flow imbalance measurements.


Best For: Traders who care about total participation and volume distribution.

Core Metric: Tick Volume (V) - Total market activity


Version 1.0
Use Comments Section to ask for more details
Available for Video Session with Setup Guide after Purchase


----------------------------------------------------------------------------------------------------------------------------------------

Core Concept

----------------------------------------------------------------------------------------------------------------------------------------

Traditional Time Bars: Fixed intervals (1 min, 5 min, etc.)

  • Problem: Market activity varies dramatically
  • Same time period can contain 10 ticks or 10,000 ticks

Volume Bars: Variable intervals based on Volume

  • Solution: Bars complete when sufficient volume accumulated
  • Adapts to market activity using EWMA threshold

----------------------------------------------------------------------------------------------------------------------------------------

Mathematical Framework

----------------------------------------------------------------------------------------------------------------------------------------

1. Tick Classification (Tick Rule) - Each tick is classified as buy or sell based on price movement.

2. EWMA Buy Proportion - Tracks the running proportion of buy ticks using exponential weighting.

3. Adaptive Threshold Calculation - The threshold adjusts based on the dominant flow direction.

4. Volume Accumulation - Track cumulative buy and sell volumes.

5. Bar Completion Condition - A bar completes when cumulative volume reaches the adaptive threshold.

6. Delta Calculation - The delta measures order flow imbalance.

----------------------------------------------------------------------------------------------------------------------------------------

Parameter Reference

----------------------------------------------------------------------------------------------------------------------------------------

Core Settings

  • Expected Bar Size E[T]: Target Volume per Bar
  • EWMA Alpha: Smoothing factor

Fallback Mode

  • Use Fallback Time-Based: Enable time-based bars ( enable sampling Volume data based on fixed time intervals)
  • Fallback Minutes: Custom Time interval for data sampling

Daily Reset

  • Daily Reset: Enable Volume Sampling Calculations Reset for each New Day / Session
  • Reset Hour: Hour for reset
  • Reset Minute: Minute for reset
  • GMT Offset: Timezone offset

Volume Filter

  • Enable Volume Filter: Toggle filtering - indicator will display only Filtered Volume Bars
  • Min Volume: Minimum volume threshold

Visual Settings

  • Show Volume Bar Labels: Toggle labels
  • Show Divergence Markers: Toggle divergence markers
  • Color Chart Candles: Toggle chart coloring
  • Bar Transparency: Volume Bars OHLC transparency
  • Bull/Bear Colors: Volume Bars Colors

----------------------------------------------------------------------------------------------------------------------------------------

References

----------------------------------------------------------------------------------------------------------------------------------------

  • López de Prado, M. - Advances in Financial Machine Learning
  • Chapter on "Information-Driven Bars"

Summary

AI summary
WT - Tick Volume Bars is an indicator for the cTrader platform that generates volume imbalance bars based on cumulative tick volume reaching an adaptive threshold. Unlike traditional time-based bars, which use fixed intervals, this indicator creates bars that adjust dynamically to market activity by measuring real-time flow imbalances. It classifies each tick as a buy or sell based on price movement, tracks the exponential weighted moving average (EWMA) of buy tick proportions, and calculates an adaptive volume threshold that determines bar completion. The indicator accumulates buy and sell volumes and measures order flow imbalance (delta) within each bar.

Key features include:
- Adaptive bar intervals based on volume rather than fixed time periods
- EWMA smoothing for threshold adjustment reflecting dominant market flow
- Optional fallback to time-based bars with customizable intervals
- Daily reset of volume sampling calculations with configurable reset time and timezone offset
- Volume filtering to display bars exceeding a minimum volume threshold
- Visual customization options such as volume bar labels, divergence markers, candle coloring, transparency, and color schemes for bullish/bearish bars

The indicator is designed for traders focused on total market participation and volume distribution across Forex, commodities, indices, and cryptocurrencies. It incorporates concepts from financial machine learning literature on information-driven bars.
Indicator profile

Customer reviews

5.0
Reviews: 1
5
100 %
4
0 %
3
0 %
2
0 %
1
0 %
Customer reviews
January 23, 2026
WT Tick Volume Bars shines on M1-M5, T -timeframes and Renko, offering clear insight into tick-volume activity and microstructure. On higher TFs the chart becomes visually overloaded. Best used as a specialized scalping and order-flow tool, not a universal volume indicator.

Discussion

FAQ

Forex
Signal
Breakout
Scalping
Indices
Commodities
Crypto
Products available through cTrader Store, including trading bots, indicators and plugins, are provided by third-party developers and made available for informational and technical access purposes only. cTrader Store is not a broker and does not provide investment advice, personal recommendations or any guarantee of future performance.

More from this author

Indicator
Prop
Forex
+12
Lightweight Risk-Reward Visualization Tool.
Desktop plugin
Forex
Crypto
+3
Build custom second and tick charts using adjustable bar sampling intervals.
Desktop plugin
Stocks
Indices
+1
Build custom charts based on specific trading sessions.
cBot
Fixed Risk %
No Overtrading
+5
Turn Your Keyboard into a Trading Console — Instant Entries, Exits, and Precision Risk Control.
Indicator
Forex
Crypto
+5
Experience a new approach with amplitude-based momentum analysis. Smart Trend Detection That Adapts to Market Volatility
Indicator
Key Levels
Supertrend
+1
A cTrader indicator for clear trend direction, entry timing, and on-chart risk visualization.
Indicator
Imbalance
Key Levels
+2
A Next-Generation Adaptive Oscillator with Z-Score Regime Engine.
Indicator
Forex
Crypto
+5
This indicator combines two independent analytical engines into a single overlay on your chart.
Desktop plugin
Chart UI Tools
Trend Reversal (TRev) charts plot candlesticks according to the distance price moves, not the passage of time.
Indicator
Imbalance
Order Block
+5
Spot the moments when price and order flow disagree - across every timeframe, at a glance.
Indicator
ATR
Supertrend
+5
Read price differently. Measure what the market actually does.
cBot
Fixed Lot
Supertrend
+5
Find the settings. Validate the strategy.
2.2
Profit factor

You may also like

Indicator
Liquidity Grab
Liquidity Sweep
+2
Visualizes accumulation ranges, manipulation sweeps and distribution phases on your cTrader chart.
Indicator
EMA
Channel
+3
Real-time squeeze detection, dual-horizon trend scoring & institutional breakout validation HUD dashboard.
Indicator
Prop
Forex
+1
Smart support/resistance indicator with rejection-only Buy/Sell signals designed for H1 charts.
Indicator
Volume
Imbalance
+5
Professional OrderFlow Footprint Analysis ( Bid/ask, POC, VA, Delta, Absorption, Imbalance )
Indicator
BOS
Fibonacci
+4
Market structure, liquidity sweeps, BOS/CHoCH, smart zones and BUY/SELL setups with Entry, SL and TP.
Indicator
Prop
Forex
+13
"Footprint Chart: Visualize bid-ask volume inside candles for clearer order flow and market depth insights."
Indicator
ADX
ATR
+3
Nine live gauges turn raw market data into one clear dashboard. Trend, volume, volatility - at a glance, any symbol.
Indicator
Prop
Forex
+3
Price Change Bundle 3-in-1 Levels • Bars • Histogram. Secret of Price Change
Indicator
ATR
Forex
+3
Order Block - Market Structure Signals - This is one of the main indicators in the Market Structure trading system
Indicator
Prop
VWAP
+15
VWAP with standard deviation bands. Fully customizable colors, periods, and multipliers for precise trading signals
Indicator
Pin Bar
Order Block
+5
Sierra Chart's Flex Renko Inverse, rebuilt for cTrader. Trends stay on one brick. Reversals print only when real.
Indicator
Signal
XAUUSD
The HAI Quantum V10 is an advanced indicator designed for technical analysis.
Indicator
RSI
Forex
+7
Advanced S/R + liquidity zone detector with auto-configured trade styles. Generates filtered entry signals with TP/SL.
Indicator
SMC
VWAP
+5
Non-Repainting Logic All Signals Are Generated In Real Time And Remain Locked Once Printed. No Hindsight Adjustments.
Indicator
Prop
Forex
+4
Risk Reward Management Tools(风险回报管理工具)
Indicator
MSS
VWAP
+5
VWAP mean-reversion signals combined with a ribbon-anchored volume profile, VAH/VAL, POC and HVN levels.
Indicator
ATR
EMA
+5
Multi-factor volatility squeeze detector, dual-trend scoring & breakout validation dashboard. No repaint.
Indicator
BOS
CHOCH
+5
Bid x ask footprint with imbalances, absorption, delta, volume profile, TPO, market read and a live position panel.

Price

98.17M
Traded volume
147.13K
Pips won
89
Sales
523
Free installs