present
Zarejestruj się i otrzymaj 50 $ zniżki na pierwszy zakup
Trading product for Opening Range Brakeout Wskaźnik Fibonacci Key Levels, image 1
Opening Range Brakeout
Wskaźnik
Wersja 1.0, Jul 2026
Windows, Mac
Trading product for Opening Range Brakeout Wskaźnik Fibonacci Key Levels, image 2
Trading product for Opening Range Brakeout Wskaźnik Fibonacci Key Levels, image 3
Trading product for Opening Range Brakeout Wskaźnik Fibonacci Key Levels, image 4
Trading product for Opening Range Brakeout Wskaźnik Fibonacci Key Levels, image 5
Od 07/05/2026
5
Sprzedaż
63
Bezpłatne instalacje

Opis

Najbardziej sprawdzony w boju setup day-tradingowy, w pełni zautomatyzowany na Twoim wykresie.

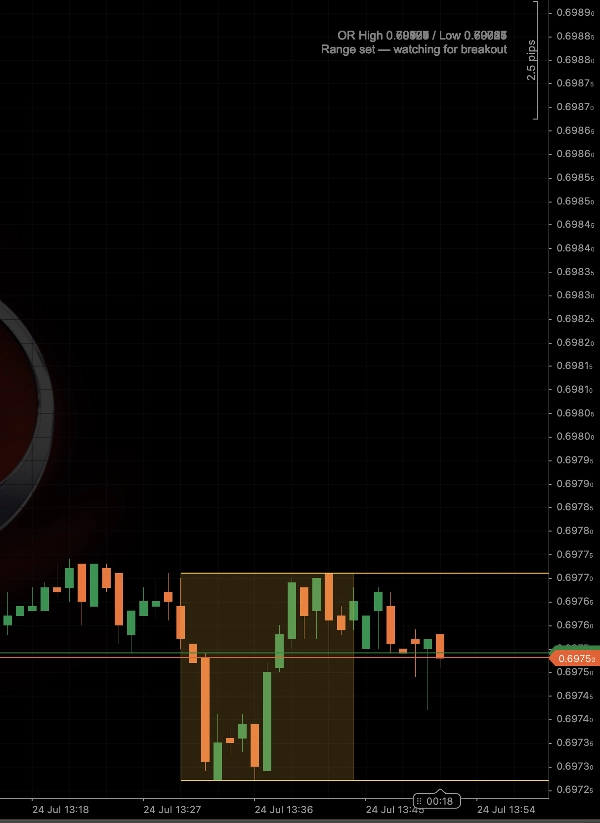
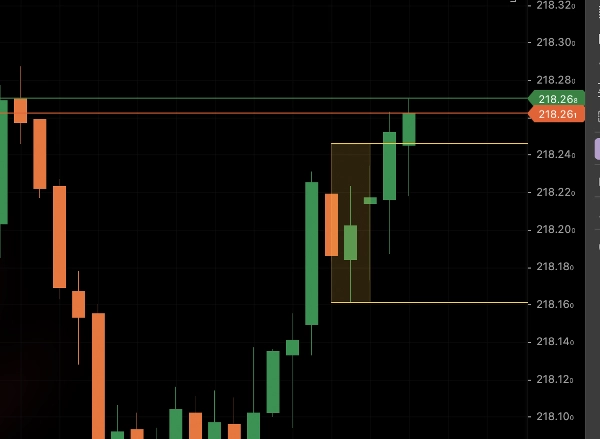
Opening Range Breakout wyznacza maksimum i minimum pierwszych minut po otwarciu sesji, a następnie informuje Cię o momencie, gdy cena faktycznie dokonuje wybicia — nie tylko przebicia knota przez poziom.

Co analizuje:

  • Opening Range — maksimum/minimum konfigurowalnego okna tuż po rozpoczęciu sesji (domyślnie: 9:30 ET, 15 minut — klasyczne otwarcie NYSE ORB)
  • Potwierdzenie wybicia — uruchamia się tylko przy pełnym zamknięciu świecy zamknięciu poza zakresem, filtrując fałszywe wybicia, które tylko przebijają knotem i zawracają
  • Filtr wzrostu wolumenu — opcjonalnie wymaga, aby wolumen świecy wybicia przekroczył wielokrotność ostatniej średniej, dzięki czemu handlujesz przekonaniem, a nie szumem

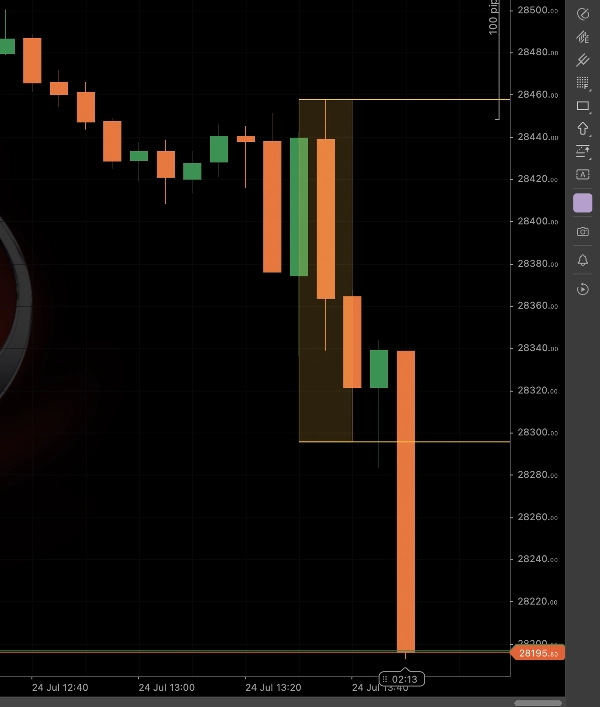
Jak to czytać: zakres wyświetla się jako zacieniowane pole z dwoma wydłużającymi się liniami podczas formowania. W momencie potwierdzenia ważnego wybicia, całe pole i obie linie zmieniają kolor na wyraźną zieleń (long) lub czerwień (short), z czytelną etykietą "LONG BREAKOUT" / "SHORT BREAKDOWN" bezpośrednio na świecy sygnałowej. Działa na całej historii Twojego wykresu, więc możesz przewinąć wstecz i zobaczyć dokładnie, jak wyglądał zakres każdej poprzedniej sesji.

Kluczowe ustawienia: Godzina rozpoczęcia OR (ET), Czas trwania OR (minuty), Mnożnik wolumenu, długość wydłużenia linii oraz przełącznik zacieniowanego pola.

Najlepiej nadaje się dla: traderów intraday na niższych interwałach (1–15 min) handlujących akcjami, indeksami lub futures z określonym otwarciem sesji — to najbardziej mechaniczny, oparty na regułach setup w detalicznym day tradingu, a to narzędzie całkowicie eliminuje ręczne rysowanie zakresów i ocenianie wybicia.

Podsumowanie

Podsumowanie AI
Opening Range Breakout is an automated indicator designed for intraday traders using lower timeframes (1–15 minutes) on stocks, indices, or futures with defined session opens. It automatically plots the high and low of a configurable opening range period (default 9:30 ET for 15 minutes) on the chart. The tool identifies and signals confirmed breakouts by detecting a full candle close beyond the range, filtering out false breakouts caused by wick pokes. An optional volume surge filter requires breakout candles to exceed a set multiple of recent average volume, emphasizing trading conviction. The indicator visually represents the opening range as a shaded box with extending lines, which turn bold green for long breakouts or red for short breakdowns upon confirmation, accompanied by clear breakout tags on the signal candle. It operates across the entire chart history, allowing review of past sessions. Key adjustable settings include the opening range start time, duration, volume multiplier, line extension length, and shaded box toggle. This indicator automates the classic 9:30 Opening Range Breakout setup, removing manual range drawing and breakout identification.
Profil wskaźnika

Opinie klientów

0.0
Opinie: 0
Opinie klientów
Ten produkt nie ma jeszcze opinii. Wypróbowałeś(-aś) go już? Bądź pierwszy(-a) i powiedz o tym innym!

Dyskusja

Częste pytania

Fibonacci
Key Levels
AI-assisted
Volume
Market Structure
Liquidity Grab
Support & Resistance
Produkty dostępne za pośrednictwem cTrader Store, w tym boty handlowe, wskaźniki i wtyczki, dostarczane są przez deweloperów zewnętrznych i udostępniane wyłącznie w celach informacyjnych oraz w celu zapewnienia dostępu technicznego. cTrader Store nie jest brokerem i nie zapewnia doradztwa inwestycyjnego, nie udziela spersonalizowanych rekomendacji ani nie gwarantuje przyszłych wyników.

Więcej od tego autora

Wskaźnik
AI-assisted
Order Block
+5
The daily bias estimator indicator uses ICT concepts to show whether the chart is bullish or bearish on multi-time frame
Wskaźnik
ATR
BOS
+5
Full ICT/SMC 4-step setup checker that alerts a long or short setup.
Wskaźnik
Flag
VWAP
+5
Session VWAP with statistical deviation bands, gradient cloud, and live rejection alerts — see exactly how stretched pri
Wskaźnik
MSS
AI-assisted
+5
Live ICT Silver Bullet detection: liquidity sweeps, structure shifts, and killzone-gated FVGs, graded and glowing in rea
Wskaźnik
ATR
Key Levels
+5
CPR indicator that actually predicts the day ahead: width percentile scoring for breakout-day detection
Wskaźnik
Triangle
Double Top
+5
Know which liquidity sweeps are real. Auto-tracks EQH/EQL and confirms genuine reversals, not just broken levels.
Wskaźnik
BOS
EMA
+5
Directional volume heatmap: see if a price zone was built on buying or selling, not just how much.
Wskaźnik
ATR
MSS
+5
Grades ICT Unicorn setups (Breaker Block + FVG confluence) into PRIME / SETUP / WATCH, with retest & RR targets.
Wskaźnik
BOS
Volume
+5
20/40/60-day IPDA lookback ranges, Premium/Discount/Equilibrium zones, and quarterly shift alerts — anchored to true dai
Wskaźnik
BOS
MSS
+5
One indicator, full ICT/SMC picture — structure, OBs, FVGs, liquidity, Premium/Discount — with graded PRIME/SETUP signal
Wskaźnik
ATR
Volume
+5
Order blocks with measured hold-rate stats and confidence scoring — not just zones on a chart.
Wskaźnik
BOS
CHOCH
+5
BOS/CHoCH signals confirmed by liquidity sweep + FVG confluence, with a live conviction score.

Możesz także polubić

Wskaźnik
Prop
Forex
+4
Risk Reward Management Tools(风险回报管理工具)
Wskaźnik
Prop
Institution-level trend Analyzer.
Wskaźnik
Signal
Order Flow Market Depth Pro | Footprint & DOM
Wskaźnik
BOS
Fibonacci
+4
Market structure, liquidity sweeps, BOS/CHoCH, smart zones and BUY/SELL setups with Entry, SL and TP.
Wskaźnik
ATR
EMA
+5
Multi-factor volatility squeeze detector, dual-trend scoring & breakout validation dashboard. No repaint.
Wskaźnik
ADX
ATR
+5
HAI QUANTUM V7.0 | The Stochastic Drift & Gravity Edition The Most Advanced Neural-Ready Trading Dashboard for cTrader
Wskaźnik
AI
ATR
+26
The Triple Momentum indicator for cTrader is a versatile trend-following tool.
Wskaźnik
MSS
Double Top
+5
Institutional SMT divergences between correlated markets. Non-repainting, kill zones, alerts. Multi-platform bonus.
Wskaźnik
SMC
Pro Volume Profile with Delta, Session Filters & CSV Export. Precision order flow analysis.
Wskaźnik
Volume
Imbalance
+2
FOOTPRINT PRO - Candles tell you where price moved
Wskaźnik
MSS
VWAP
+5
VWAP mean-reversion signals combined with a ribbon-anchored volume profile, VAH/VAL, POC and HVN levels.
Wskaźnik
Smart Signal Reversal Trend + Patterns
Wskaźnik
ATR
BOS
+5
Apex Strike: Multi-timeframe (M5-H1) non-repainting indicator with winrate dashboard & alerts (Gold, BTC).
Wskaźnik
ATR
Signal
One of the best indicators we have ever developed, with a very high profit ratio.
Wskaźnik
BOS
CHOCH
+5
Bid x ask footprint with imbalances, absorption, delta, volume profile, TPO, market read and a live position panel.
Wskaźnik
Forex
Crypto
+3
This is a tool to help traders open orders/close orders/modify orders quickly with just one click
Wskaźnik
EMA
Channel
+3
Real-time squeeze detection, dual-horizon trend scoring & institutional breakout validation HUD dashboard.
Wskaźnik
Volume
Imbalance
+5
Professional OrderFlow Footprint Analysis ( Bid/ask, POC, VA, Delta, Absorption, Imbalance )

Cena

Od 07/05/2026
5
Sprzedaż
63
Bezpłatne instalacje