
Description
EMAScalpHistogram : Visualisation du momentum pour la gestion des trades
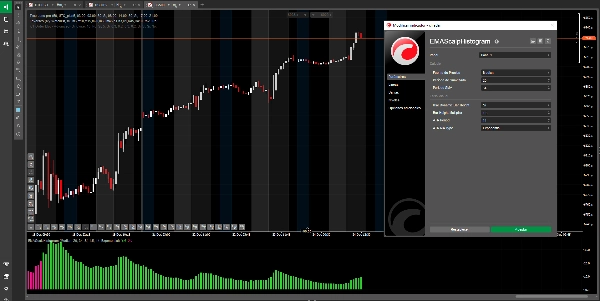
Qu'est-ce que EMAScalpHistogram ?
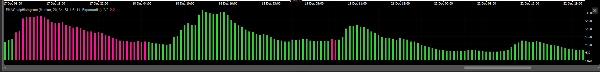
EMAScalpHistogram est un outil d'analyse technique avancé qui transforme la complexité du momentum du marché en un histogramme intuitif et visuellement attrayant. Sa conception permet d'identifier la force et la direction de la tendance en un seul coup d'œil.
- Barres vertes (haussières) : Indiquent un fort momentum d'achat, suggérant que les acheteurs contrôlent le marché.
- Barres roses (baissières) : Indiquent un fort momentum de vente, suggérant que les vendeurs dominent l'action des prix.
- Hauteur dynamique : La hauteur des barres n'est pas fixe ; elle s'adapte à la volatilité du marché. Des barres plus hautes signalent des mouvements avec plus de force et de conviction, tandis que des barres plus courtes indiquent une pause ou un affaiblissement de la tendance.
Usage principal et stratégie recommandée
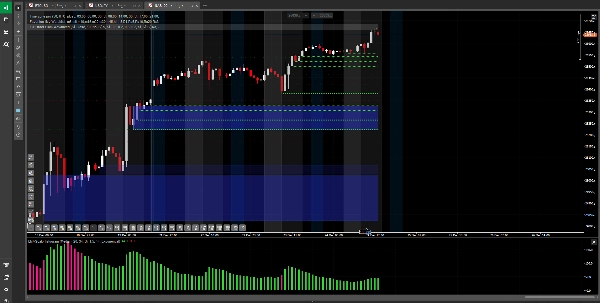
EMAScalpHistogram est un outil de gestion des trades d'élite, conçu pour les traders qui cherchent à maximiser leurs profits en maintenant leurs positions avec plus de confiance. Sa plus grande valeur réside dans le fait de vous aider à maintenir et amplifier vos profits une fois que vous êtes déjà en position.
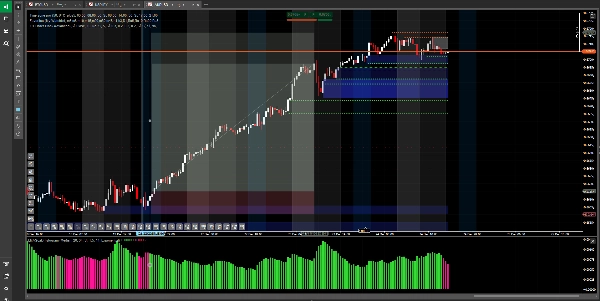
- Confirmation de tendance : Sa fonction la plus puissante est de valider la force d'une tendance que vous avez déjà identifiée. Si vous êtes en position longue et que l'histogramme affiche constamment des barres vertes, c'est une confirmation visuelle que le momentum d'achat reste intact.
- Gestion des trades (maintenir et amplifier les profits) :
-
- Pour maintenir les positions : C'est son application la plus précieuse. Utilisez-le pour décider quand maintenir une position avec confiance. Si l'histogramme continue d'afficher des barres en votre faveur, cela vous donne la discipline de ne pas clôturer prématurément un trade rentable à cause de fluctuations mineures du marché.
- Pour amplifier les profits : En vous aidant à maintenir la position tout au long de la phase de momentum fort, il vous permet de capturer des mouvements plus importants et d'amplifier votre potentiel de profit.
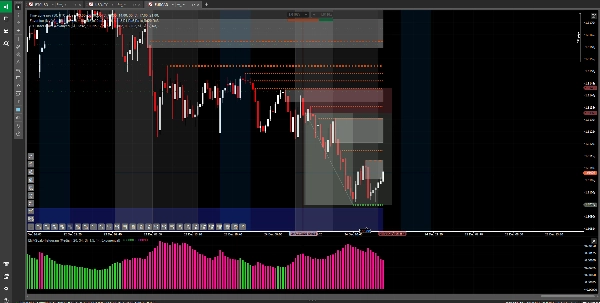
- Alerte d'affaiblissement du momentum : Un changement de couleur de l'histogramme (du vert au rose ou inversement) est l'une des premières alertes indiquant que le momentum s'épuise, suggérant qu'il pourrait être temps de sécuriser les profits ou d'ajuster votre stratégie de sortie.
Ce qu'il faut éviter
Pas un signal d'entrée : De manière critique, EMAScalpHistogram n'est pas conçu pour être utilisé comme un signal autonome pour ouvrir de nouvelles positions. En tant qu'indicateur qui confirme la force d'un mouvement déjà en cours, l'utiliser pour l'entrée peut entraîner des trades tardifs avec un risque élevé et un potentiel de profit limité.
Avertissement sur les risques et clause de non-responsabilité
L'utilisation de cet indicateur se fait à vos propres risques et responsabilités. Le trading d'instruments financiers comporte un niveau de risque élevé et peut ne pas convenir à tous les investisseurs. Cet outil ne constitue pas une recommandation d'investissement ni un conseil financier. Les performances passées ne garantissent pas les résultats futurs. Il est fortement recommandé de tester toute stratégie sur un compte démo avant de risquer du capital réel.
Résumé
Avis clients
5 | 67 % | |
4 | 33 % | |
3 | 0 % | |
2 | 0 % | |
1 | 0 % |


