
Description
BB20 Multicolore
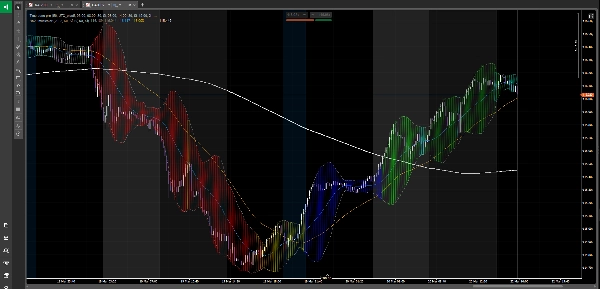
Un indicateur puissant d'identification des cycles de marché qui se superpose directement sur votre graphique, codant en couleur l'action des prix à travers 8 états de marché distincts — du baissier profond au totalement haussier — en utilisant la relation entre le prix et quatre moyennes mobiles clés (MM20, MM50, MM100, MM200) combinées avec les Bandes de Bollinger.
──────────────────────────
COMMENT ÇA FONCTIONNE
──────────────────────────
L'indicateur évalue constamment la position du prix par rapport aux quatre moyennes mobiles et attribue une des 8 couleurs à la zone nuage des Bandes de Bollinger, vous donnant une lecture visuelle instantanée de la phase actuelle du cycle de marché :
🔴 ROUGE — Tendance baissière claire
Le prix est en dessous de la MM200. Le marché est dominé par les vendeurs. Biais : uniquement à la baisse.
🟠 ORANGE — Rebond technique
Le prix est en dessous de la MM200 mais s'est redressé au-dessus de la MM20. Un rebond dans une tendance baissière — pas un renversement. Zone commune de piège haussier.
🟡 JAUNE — Phase 1 du cycle
Le prix a franchi la MM50 à la hausse mais les moyennes mobiles sont encore baissières. Premiers signes de reprise, pas encore confirmés.
🔵 BLEU — Tentative de renversement de tendance
MM100 et MM50 sont en dessous de la MM200, mais le prix commence à grimper entre elles. Zone de transition à forte volatilité — surveillez attentivement.
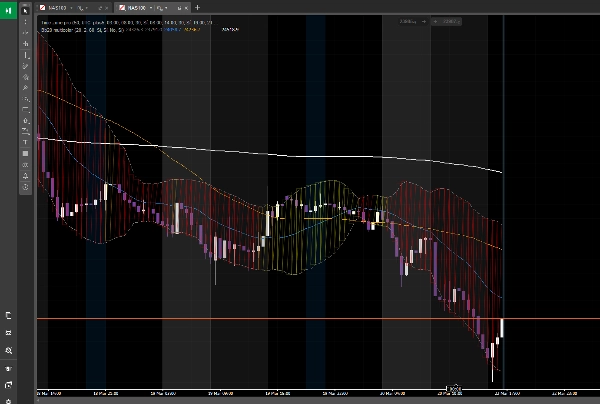
⬜ GRIS — Neutre / affaiblissement
Le prix est au-dessus de la MM200 mais en dessous de la MM100. La structure à long terme est encore haussière mais le momentum faiblit. Zone de prudence.
🟢 VERT CITRON — Phase 2 du cycle
Le prix et la MM50 sont au-dessus de la MM200. Un nouveau cycle haussier est en cours de confirmation. De nombreux traders institutionnels commencent à se positionner ici.
🪵 BLEU CANARD — Consolidation saine
Le prix est au-dessus de la MM200 et de la MM100 mais revient vers la MM50 ou la MM20. Une pause normale dans une tendance haussière — zone potentielle de réentrée.
🌲 VERT FONCÉ — Cycle haussier mature
Toutes les moyennes mobiles parfaitement alignées : MM200 < MM50 < MM20 < Prix. Environnement de tendance le plus clair. Résistance minimale à la hausse.
──────────────────────────
CARACTÉRISTIQUES
──────────────────────────
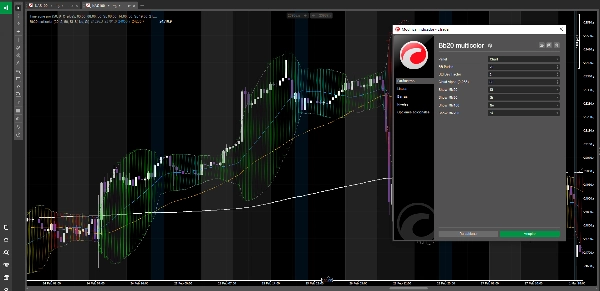
• Zones nuage rendues nativement avec Chart.DrawTriangle de cTrader pour des remplissages lisses et professionnels
• Bandes de Bollinger (supérieure et inférieure) affichées à côté du nuage
• Les quatre moyennes mobiles sont individuellement activables (MM20, MM50, MM100, MM200)
• Période BB configurable, facteur d'écart-type et transparence du nuage
• Fonctionne sur n'importe quel instrument et n'importe quelle unité de temps
• Entièrement open source — gratuit pour toujours
──────────────────────────
COMMENT L'UTILISER
──────────────────────────
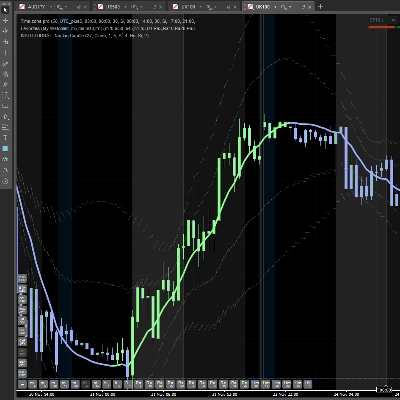
1. Utilisez la couleur comme filtre de contexte de marché avant de prendre une position
2. Ne cherchez des positions longues que lorsque le fond est vert (citron ou foncé)
3. Ne cherchez des positions courtes que lorsque le fond est rouge ou orange
4. Utilisez le jaune, le bleu et le gris comme zones de transition — réduisez la taille ou attendez une confirmation
5. Le bleu canard est votre zone de réentrée dans une tendance haussière établie
Compatible avec toute stratégie de trading. Particulièrement efficace lorsqu'il est combiné avec l'action des prix, l'analyse du volume ou les approches basées sur le sentiment.
Installez-le, appliquez-le sur votre graphique, et sachez instantanément dans quelle phase se trouve le marché.
⚠️ AVERTISSEMENT SUR LES RISQUES
Le trading d'instruments financiers comporte des risques et n'est pas adapté à tout le monde. Faites toujours votre propre analyse, gérez soigneusement votre risque, et ne tradez jamais avec de l'argent que vous ne pouvez pas vous permettre de perdre.
Cet indicateur est un outil d'analyse technique — pas un conseil financier. Utilisez-le judicieusement.
Résumé
- Red: Clear bearish trend (price below MM200)
- Orange: Technical bounce within bearish trend
- Yellow: Early recovery signs (price above MM50, but MAs bearish)
- Blue: Trend reversal attempt with high volatility
- Gray: Neutral or weakening momentum (price above MM200 but below MM100)
- Lime Green: Confirmed new bullish cycle (price and MM50 above MM200)
- Teal: Healthy consolidation in bullish trend (price above MM200 and MM100, pulling back)
- Dark Green: Mature bullish cycle with aligned moving averages
Features include native cloud rendering using cTrader's Chart.DrawTriangle, toggleable moving averages, configurable Bollinger Bands parameters, and compatibility with any instrument and timeframe. The indicator is open source and free to use. It serves as a market context filter to guide trade decisions, recommending long positions in green zones and shorts in red/orange zones, with caution advised in transition colors. It complements various trading strategies, including price action and volume analysis.


![Logo de "Smart Money Concepts (SMC) [Iridio Capital]"](https://cdn.ctrader.com/image/webp/28b69fd1-ef54-4bed-9487-07e78e883be4_40934)


