Açıklama
🚀 KURUMSAL Nonlag Candle - Profesyonel Ticaret Göstergesi
Kurumsal Seviyede Hareketli Ortalama Teknolojisi ile Ticaretinizi Dönüştürün
KURUMSAL Nonlag Candle, hassasiyet, doğruluk ve kurumsal düzeyde piyasa analizi talep eden ciddi tüccarlar için tasarlanmış en gelişmiş hareketli ortalama sistemidir.
💎 Bu Göstergenin Her Şeyi Değiştirmesinin Nedeni
Fiyat hareketlerinin gerisinde kalan geleneksel hareketli ortalamaların aksine, bu gösterge gelişmiş matematiksel algoritmalar kullanarak gecikmeyi ortadan kaldırırken doğruluğu korur. Kurumsal tüccarların piyasa hareketlerinin önünde kalmak için kullandığı aynı teknolojidir.
✨ Onu Öne Çıkaran Temel Özellikler:
🎯 Sıfır Gecikmeli Teknoloji
- Standart hareketli ortalamaların tipik gecikmesi olmadan fiyat hareketlerine gerçek zamanlı yanıt verir
- Herhangi bir EMA, SMA veya WMA'dan daha erken trend değişikliklerini yakalar
- Scalping, günlük ticaret ve swing ticareti için mükemmeldir
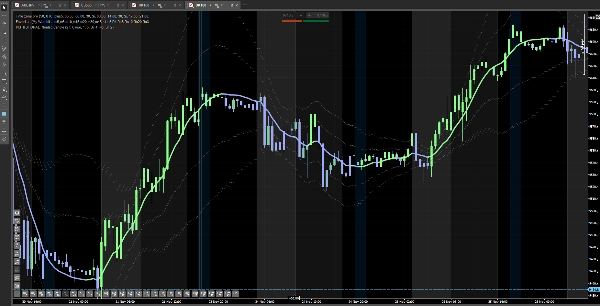
📊 Kurumsal Sapma Bantları
- Otomatik olarak 1, 2 veya 3 standart sapma bandı gösterir
- Aşırı alım/aşırı satım koşullarını cerrahi hassasiyetle tanımlar
- Fiyatın çok hızlı ve çok fazla hareket ettiğini tam olarak gösterir
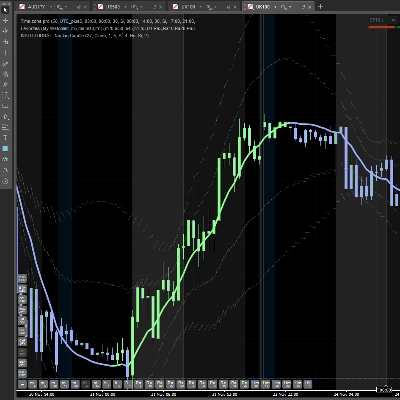
🎨 Görsel Netlik Sistemi
- Renk kodlu mumlar ve çizgiler (Yeşil = Boğa, Kırmızı = Ayı, Gri = Nötr)
- Trend yönünün anında görsel onayı
- Tahmin yok - piyasa size ne yaptığını söyler
⚡ Hacim Ağırlıklı Zeka (Opsiyonel)
- Daha doğru okumalar için hacim verilerini entegre eder
- Zayıf hareketler ile güçlü kurumsal faaliyetleri ayırt eder
- Yüksek hacimli fiyat hareketlerine daha fazla ağırlık verir
🎯 Profesyonel Tüccarlar Bu Göstergeleri Nasıl Kullanır
Strateji 1: Yüksek Olasılıklı Girişler
Kurulum: Piyasa boğa trendinde, ancak fiyat 2. veya 3. üst banda dokunuyor.
Eyleminiz: Kovalama! Fiyat aşırı genişlemiş. Geri çekilmeyi bekleyin.
Giriş: Fiyat Nonlag Candle çizgisine geri döndüğünde ve mum rengi YEŞİL KALDIĞINDA (kırmızıya dönmez), bu sizin sinyalinizdir - dip alınabilir ve trend sağlamdır.
Neden İşe Yarar: Onaylanmış bir yükseliş trendinde indirimli fiyatla alıyorsunuz. Daha iyi giriş = daha sıkı stop loss = daha iyi risk/ödül.
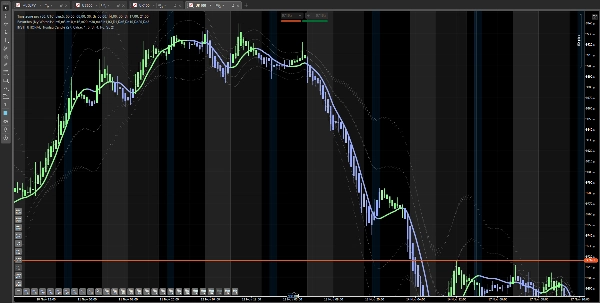
Strateji 2: Trend Tersine Dönüş Tespiti
Kurulum: Fiyat düşüş trendinde ve alt bantlara tekrar tekrar dokunuyor.
Sinyal: Fiyat 2. veya 3. alt banttan sıçrar VE Nonlag Candle kırmızıdan yeşile döner.
Eyleminiz: Hemen uzun pozisyona girin. Piyasa yapısı ayıdan boğaya kaydı.
Neden İşe Yarar: Ters dönüşü doğuşunda yakalıyorsunuz, 100+ pip hareket ettikten sonra değil.
Strateji 3: Profesyonel Gibi Kar Almak
Boğa Ticareti:
- Giriş: Yükseliş trendinde Nonlag Candle yakınında
- Kısmi kar: Fiyat 1. üst banda ulaştığında (hızlı scalp)
- Tam kar: Fiyat 2. veya 3. üst banda ulaştığında (maksimum uzama)
Neden İşe Yarar: Bantlar size istatistiksel olarak aşırı fiyat seviyelerini gösterir. Fiyat 3. banda ulaştığında, geri çekilme olasılığı yüksektir - kurumsal tüccarlar orada kar alır, siz de almalısınız.
🔥 Bu Göstergeleri Normal MA'lardan Farklı Kılan Nedir
Standart hareketli ortalamalar yüksek gecikme süresine sahiptir (3-10+ bar geride), aşırı alım/aşırı satım bölgeleri yoktur, sadece temel bir çizgi gösterir, hacmi entegre etmez, geç giriş zamanlaması sağlar ve birçok yanlış sinyal üretir.
KURUMSAL Nonlag Candle neredeyse sıfır gecikme süresi ile gerçek zamanlı yanıt verir, 3 seviyeli sapma bantları içerir, renk kodlu mumlar ve çizgi, opsiyonel hacim entegrasyonu, optimal giriş zamanlaması ve sapma bantlarıyla filtrelenmiş sinyaller sunar.
Fark açıktır: geleneksel hareketli ortalamalar sizi piyasayı kovalamaya zorlar, bu gösterge ise hareketin önünde olmanızı sağlar.
💰 Gerçek Ticaret Senaryoları
Senaryo 1: Mükemmel Geri Çekilme UK100 güçlü bir şekilde yükseliyor. Fiyat 3. üst banda fırlıyor. FOMO ile satın almak yerine bekliyorsunuz. Fiyat yeşil Nonlag Candle çizgisine geri çekiliyor. Çizgi yeşil kalıyor. GİRİŞ. Sonuç: Kalabalığın kovaladığı fiyattan 80 puan daha ucuza aldınız.
Senaryo 2: Tuzaktan Kaçınma EUR/USD düşüyor. 2. alt banttan sıçrıyor. Çoğu tüccar burada alır, ancak Nonlag Candle hala KIRMIZI. Siz dışarıda kalıyorsunuz. Fiyat 50 pip daha düşüyor. Hesabınızı kurtardınız.
Senaryo 3: Scalper'ın Rüyası 5 dakikalık grafiklerde scalping yapıyorsunuz. Nonlag Candle yeşile dönüyor. Giriş yapıyorsunuz. Fiyat 15 dakika içinde 1. üst banda ulaşıyor. 20 pip ile çıkıyorsunuz. Seans başına 4-5 kez tekrarlayın. Günde 80-100 pip minimal riskle.
🎓 Bu Göstergeleri Kimler Kullanmalı?
✅ Günlük Tüccarlar - Kesin sinyallerle hızlı giriş ve çıkışlar
✅ Scalperlar - Bantlar size mükemmel kar hedefleri verir
✅ Swing Tüccarları - Büyük trend değişikliklerini erken tespit edin
✅ Yeni Başlayanlar - Renk kodlu sistem karar vermeyi basitleştirir
✅ Profesyoneller - Ciddi ticaret için kurumsal düzeyde araçlar
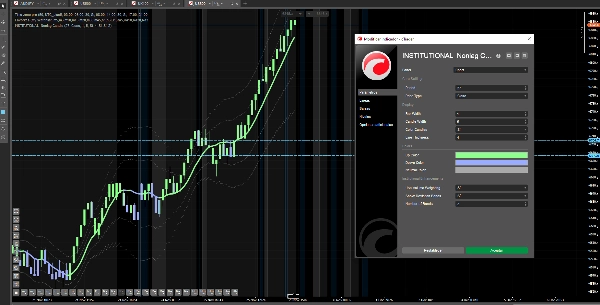
⚙️ Tamamen Özelleştirilebilir
- Dönem ayarı - Her zaman dilimi için optimize edin (1dk'dan Günlük'e)
- Fiyat tipi seçimi - Kapanış, Tipik, Ağırlıklı veya özel
- Bant seviyeleri - 1, 2 veya 3 sapma bandı seçin
- Renk şemaları - Grafik estetiğinize uyacak şekilde
- Hacim ağırlığı - Stratejinize göre açıp kapatın
🛡️ Risk Yönetimi Dahili
Sapma bantları sadece girişler için değil - aynı zamanda sizin risk yönetimi sisteminiz:
- Stop Loss: Nonlag Candle çizgisinin altına yerleştirin (veya daha sıkı stoplar için 1. bandın altına)
- Pozisyon Büyüklüğü: 2./3. bantlarda giriş yaparken boyutu küçültün (uzun hareketler)
- Kar Hedefleri: Bantlar aracılığıyla otomatik olarak görünür - tahmin yok
🚀 Bugün Daha Akıllı Ticaret Yapmaya Başlayın
Bu sadece başka bir hareketli ortalama değil. Bu, size gösteren tam bir ticaret sistemi:
✅ Ne zaman girileceğini (renk değişimi + bant pozisyonu)
✅ Ne zaman beklenileceğini (fiyat aşırı bantlarda)
✅ Ne zaman çıkılacağını (karşı bant ulaşıldığında)
✅ Ne zaman dışarıda kalınacağını (çelişkili sinyaller)
Eski göstergelerle ticareti bırakın. Kurumsal zekayla ticarete başlayın.
📈 Tüm Piyasalarda Çalışır
- Forex (EUR/USD, GBP/USD, USD/JPY, vb.)
- Endeksler (US30, UK100, NAS100, GER40)
- Emtialar (Altın, Petrol, Gümüş)
- Kripto Paralar (BTC, ETH)
- Tüm zaman dilimleri (1dk'dan Aylık'a)
🎁 Sınırlı Süreli Teklif
Bugün KURUMSAL Nonlag Candle alın ve ticaretinizi reaktiften proaktif hale getirin.
Güvenle ticaret yapın. Hassasiyetle ticaret yapın. Kurumsal araçlarla ticaret yapın.
Bu gösterge cTrader platformu ile uyumludur. Tek seferlik satın alma, ömür boyu güncellemeler dahildir.
Özet
Müşteri değerlendirmeleri
5 | 50 % | |
4 | 50 % | |
3 | 0 % | |
2 | 0 % | |
1 | 0 % |


