
说明
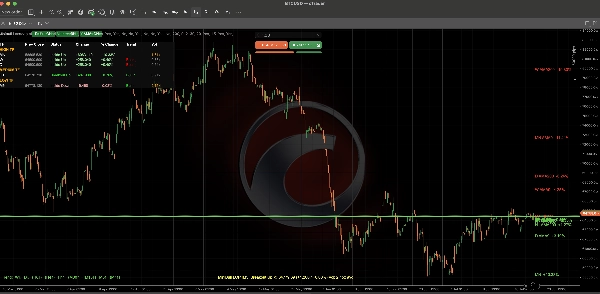
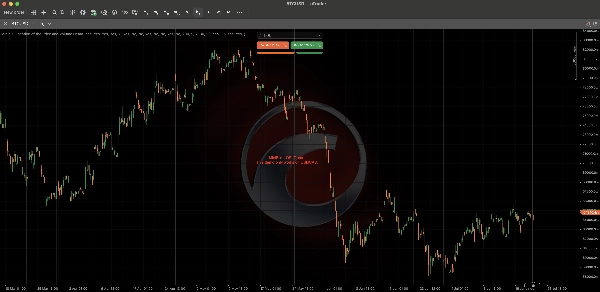
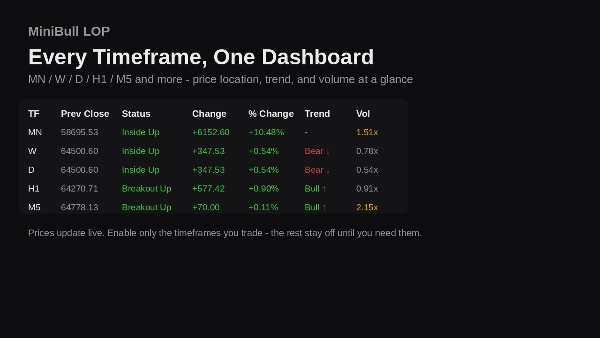
MiniBull 价格位置(LOP)准确显示价格相对于每个重要时间框架的上一个收盘柱的位置:月线、周线、日线、H8、H4、H1、M30、M15、M5、M1(可配置;默认激活五个)。
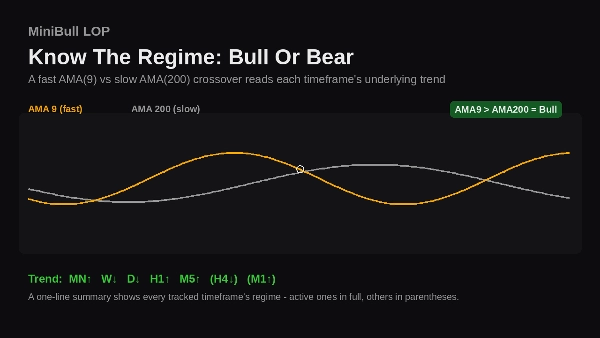
对于每个时间框架:前一收盘价、绝对及百分比变化、基于双AMA(9/200)交叉的多空趋势读取,以及与自身平均值的成交量比率,均在一个图表内仪表盘中,通过点击切换显示。
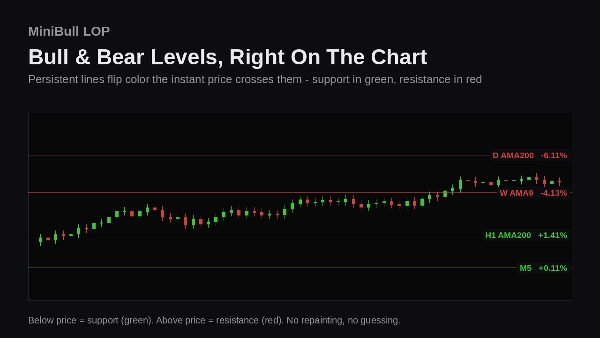
持久的颜色编码线条(绿色=支撑,红色=阻力)标记图表上的每个水平并实时更新,因此您无需打开子窗口即可随时了解价格位置。
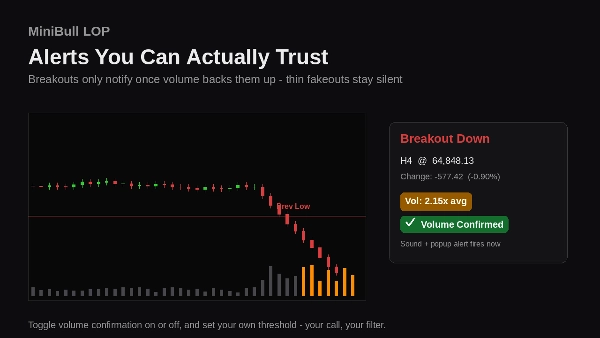
突破警报(声音+弹窗)在价格突破前高或前低时触发,可选择要求成交量确认,过滤掉薄弱、低信心的假突破。
图表底部的紧凑趋势摘要提供一行市场情绪读取,涵盖所有跟踪的时间框架,无论是否激活。
为跨时间框架思考的交易者打造:发现一致性,发现背离,永远不会丢失价格相对于昨日、上周或上月的轨迹。
摘要
AI 摘要
Minibull Location of the Price and Volume is a multi-timeframe trading indicator designed to display the current price position relative to the last closed bar across key timeframes including Monthly, Weekly, Daily, and intraday intervals (H8, H4, H1, M30, M15, M5, M1). It provides a compact on-chart dashboard showing previous close, absolute and percentage price changes, a Bull/Bear trend signal derived from a dual Adaptive Moving Average (AMA) crossover (periods 9 and 200), and a tick-volume ratio compared to its average. The indicator features persistent, color-coded support (green) and resistance (red) lines that update live on the chart, enabling quick visual identification of key levels without opening additional windows. Breakout alerts with sound and popup notifications trigger when price surpasses prior highs or lows, with optional volume confirmation to reduce false signals. A concise trend summary at the chart’s bottom offers a one-line market mood overview across all tracked timeframes. This tool is intended for traders analyzing price and volume alignment or divergence across multiple timeframes to maintain situational awareness of price relative to recent closes.
指标配置
指标分类
趋势
输出类型
可视化
信号
数据要求
仅 K 线
交易量
支持的信号
交叉
突破
突破水平位
讨论
客户评价
0.0
评价:0
客户评价
该产品尚无评价。已经试过了?抢先告诉其他人!
常见问答
SMA
Key Levels
Volume
Moving Average
Support & Resistance
cTrader Store 提供的所有产品,包括交易机器人、指标和插件,均由第三方开发者提供,仅供信息参考和技术访问之用。cTrader Store 并非经纪商,不提供投资建议、个人推荐或任何未来业绩保证。