


说明
📊 资金流动概况
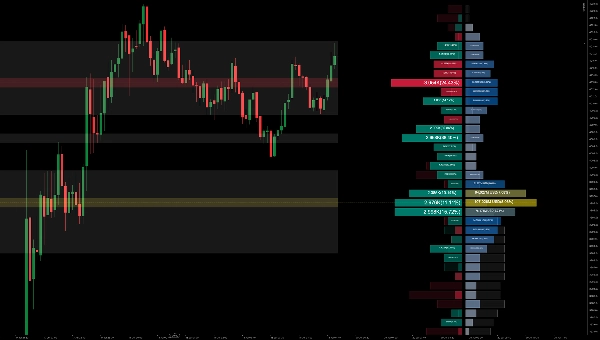
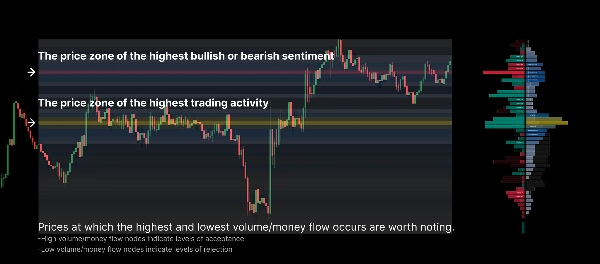
资金流动概况是一种高级图表工具,用于测量市场在指定时间段内所有价格水平上的交易量或资金流。它突出显示资产价格与交易者买卖意愿之间的关系,使您能够:
- 揭示关键价格水平:轻松识别交易量集群和高流动性节点,如控制点(POC)。
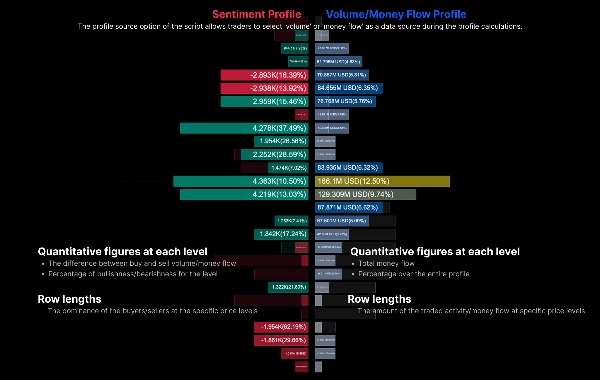
- 分析市场情绪:通过在左侧显示情绪概况,右侧显示交易量概况,确定在每个特定价格水平上买方或卖方的主导地位。
- 跨周期比较:直接将当前概况与上一周期的幽灵概况进行比较,以观察市场重心的变化。
⚙️ 核心参数及使用指南
1. 通用设置
- 回溯长度 / 固定范围:定义用于计算概况的历史K线数量(例如,最近200根K线)。
- 数据来源:
-
1 = 交易量:基于传统的成交量/交易量计算概况。2 = 资金流:结合价格深度计算资金流分布。
2. 概况设置
- 行分辨率(行数):决定垂直轴的细分程度。数值越高(例如50-100),概况越详细。
- 概况宽度及水平偏移:调整概况绘制的宽度(百分比)及向右的偏移距离,防止与当前K线重叠。
3. 情绪及显示
- 情绪极性:
-
1 = K线:仅根据K线的开盘和收盘(极性)确定多空情绪。2 = 买卖压力:采用更精确的计算,考虑影线及收盘价相对于最高/最低价的位置。
- 显示情绪概况 / 交易量概况:独立开关,分别显示净情绪概况(左侧)和主要交易量概况(右侧)。
- 显示前一周期:启用时绘制背景“幽灵柱”概况,表示上一周期的完全相同时间窗口。非常适合跟踪支撑/阻力的变化。
4. 扩展区域显示
- 显示热力图:将整个计算周期的概况密度投影为背景热力图。您可以选择投影“交易量”或“情绪”。
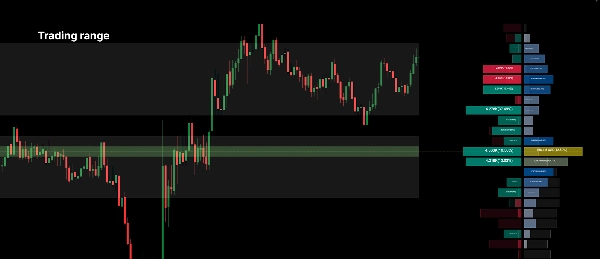
- 显示价值区:突出显示大部分交易量发生的核心价格区间。阈值可自定义(例如70%)。
- 显示POC区域:自动绘制水平线和区域,标示所选范围内交易量最高的控制点(POC)价格水平。
💡 实用交易技巧:
- 寻找高交易量节点(峰值)作为强支撑或阻力位。
- 寻找低交易量节点(谷值),因为价格往往会快速穿过这些低流动性区域。
- 利用前一周期幽灵概况:如果当前POC(黄色线)高于上一周期的POC,表明价值共识正在上移,通常是看涨信号。
摘要
AI summary
Money Flow Profile is an advanced indicator that maps traded volume and market sentiment across price levels over a specified time period. It visualizes the relationship between price and trader activity, highlighting key liquidity zones such as volume clusters and the Point of Control (POC). The tool displays a Sentiment Profile on the left and a Volume Profile on the right, enabling users to assess whether buyers or sellers dominate at each price level. It supports direct comparison with the previous period’s profile via a ghost overlay to track shifts in market value consensus.
Core configurable parameters include lookback length, data source selection (volume or money flow), row resolution for vertical granularity, profile width and offset, and sentiment polarity calculation methods (candle-based or buy/sell pressure). Display options allow toggling of sentiment and volume profiles, previous period overlays, heatmaps of volume or sentiment density, value area highlighting, and automatic POC zone marking.
The indicator is designed to help identify strong support and resistance levels at high volume nodes and anticipate rapid price movements through low volume nodes. It supports detailed volume and sentiment analysis to inform trading decisions based on liquidity and market structure.
Core configurable parameters include lookback length, data source selection (volume or money flow), row resolution for vertical granularity, profile width and offset, and sentiment polarity calculation methods (candle-based or buy/sell pressure). Display options allow toggling of sentiment and volume profiles, previous period overlays, heatmaps of volume or sentiment density, value area highlighting, and automatic POC zone marking.
The indicator is designed to help identify strong support and resistance levels at high volume nodes and anticipate rapid price movements through low volume nodes. It supports detailed volume and sentiment analysis to inform trading decisions based on liquidity and market structure.
指标配置
指标分类
交易量
输出类型
可视化
数据要求
交易量
市场深度
仅 K 线
跳动点数据
支持的信号
突破
趋势强度
反转
波动性
触及水平位
突破水平位
客户评价
0.0
评价:0
客户评价
该产品尚无评价。已经试过了?抢先告诉其他人!
讨论
常见问答
Key Levels
Volume
cTrader Store 提供的所有产品,包括交易机器人、指标和插件,均由第三方开发者提供,仅供信息参考和技术访问之用。cTrader Store 并非经纪商,不提供投资建议、个人推荐或任何未来业绩保证。
该作者的其他作品




















价格
534.4M
交易量
9.76M
盈利点数
4
销售