present
Zarejestruj się i otrzymaj 50 $ zniżki na pierwszy zakup
Trading product for Supply Demand Quadra Zones Wskaźnik EMA Key Levels, image 1
Supply Demand Quadra Zones
Wskaźnik
1 zakupy
Wersja 1.0, Sep 2026
Windows, Mac
Trading product for Supply Demand Quadra Zones Wskaźnik EMA Key Levels, image 2
Trading product for Supply Demand Quadra Zones Wskaźnik EMA Key Levels, image 3
Trading product for Supply Demand Quadra Zones Wskaźnik EMA Key Levels, image 4
Trading product for Supply Demand Quadra Zones Wskaźnik EMA Key Levels, image 5
Trading product for Supply Demand Quadra Zones Wskaźnik EMA Key Levels, image 6
Trading product for Supply Demand Quadra Zones Wskaźnik EMA Key Levels, image 7
Trading product for Supply Demand Quadra Zones Wskaźnik EMA Key Levels, image 8
Trading product for Supply Demand Quadra Zones Wskaźnik EMA Key Levels, image 9
Trading product for Supply Demand Quadra Zones Wskaźnik EMA Key Levels, image 10
Trading product for Supply Demand Quadra Zones Wskaźnik EMA Key Levels, image 11
12
Sprzedaż
197
Bezpłatne instalacje

Opis

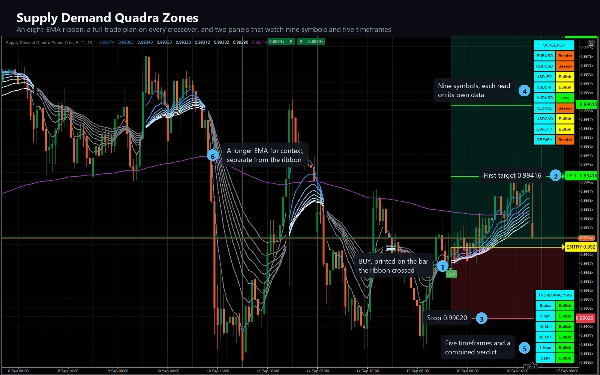
Supply Demand Quadra Zones umieszcza sygnał wejścia, narysowany plan ryzyka oraz szerszy kontekst rynku na jednym wykresie.


CO RYSUJE


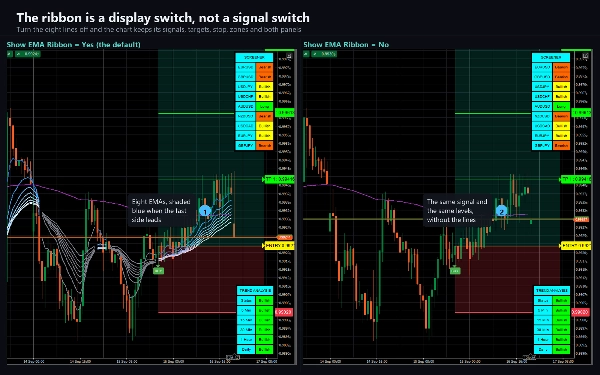
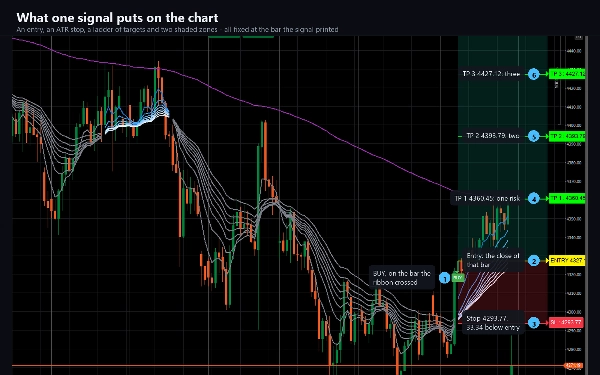
Wstęgę EMA z ośmioma liniami (5, 11, 15, 18, 21, 24, 28, 34), która zmienia kolor na niebieski, gdy szybka noga prowadzi, a na szary, gdy nie prowadzi, oraz linię odniesienia 200-okresową. Gdy EMA 2 przecina EMA 8 od dołu, rysowana jest płytka KUPNA; gdy przecina z powrotem, pojawia się płytka SPRZEDAŻY.


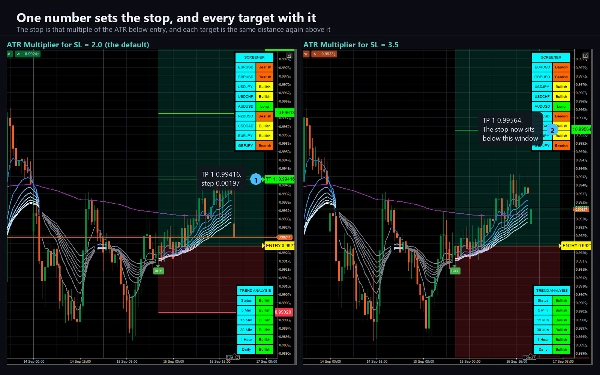
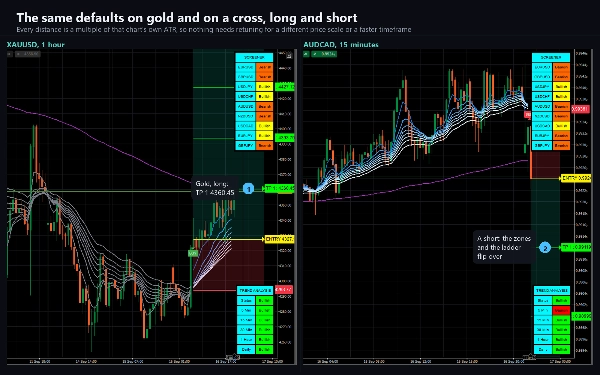
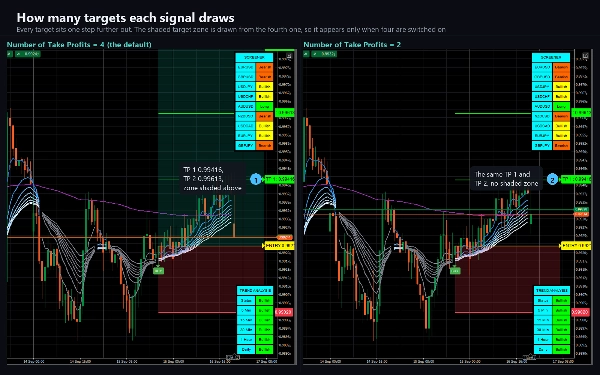
Każdy sygnał zawiera kompletny plan ryzyka już na wykresie: linię wejścia, stop umieszczony na wielokrotności ATR oraz do czterech poziomów take-profit rozmieszczonych jako wielokrotności tej odległości stopa. Przy ustawieniach domyślnych drabina to 1R, 2R, 3R i 4R. Każdy poziom ma swoją cenę po prawej krawędzi, a przestrzeń między wejściem a celem oraz między wejściem a stopem jest zacieniona, dzięki czemu kształt transakcji jest czytelny na pierwszy rzut oka. Cały plan podąża za ceną i zamraża się, gdy transakcja się rozstrzyga – albo dotknięty zostaje stop, albo osiągnięty jest każdy włączony cel.


DWA PANELE


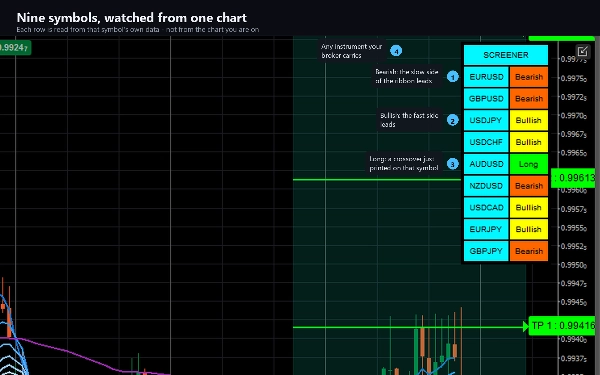
Skaner klasyfikuje do dziewięciu wybranych symboli – wszystkie odczytywane na własnym interwale czasowym wykresu – jako Long, Short, Byczy lub Niedźwiedzi, dzięki czemu możesz zobaczyć, które inne rynki ustawiają się w ten sam sposób bez otwierania dziewięciu wykresów.


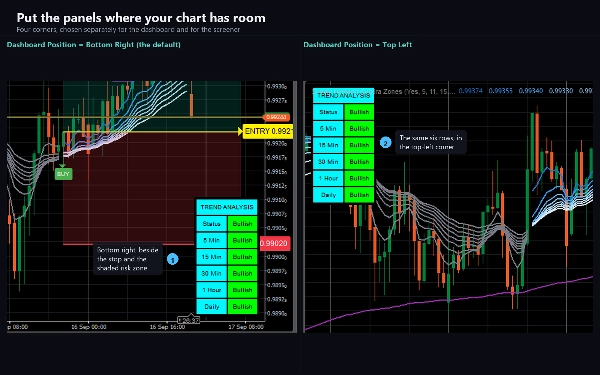
Panel trendu raportuje kierunek na 5-minutowym, 15-minutowym, 30-minutowym, 1-godzinnym i dziennym interwale dla symbolu wykresu, plus połączony wiersz Status decydowany większością głosów z trzech wybranych przez Ciebie interwałów czasowych.


WEBHOOK


Każdy sygnał i każdy krok następującej po nim transakcji może być wysłany metodą POST jako JSON na wybrany przez Ciebie URL – dzięki czemu zewnętrzny bot, dziennik lub usługa powiadomień mogą działać na jego podstawie bez konieczności obserwowania wykresu. Wysyła stronę, wejście, stop oraz pełną drabinę celów, a następnie wiadomość dla każdego osiągniętego celu, dla stopa i dla zamknięcia transakcji. Jest wyłączony, dopóki nie wpiszesz URL, nigdy nie działa podczas ładowania historii ani podczas testu wstecznego i nie wymaga podwyższonych uprawnień.


Alerty są również dostarczane przez dziennik cTrader, dźwięk i e-mail.


PRZEMALOWYWANIE, WYJAŚNIONE PROSTO


Sygnały KUPNA i SPRZEDAŻY nie przemalowują się. Są podejmowane na zamkniętych słupkach i nigdy nie zmieniają się po narysowaniu.


Dwa panele przemalowują się. Oba są rysowane na żywym słupku i odczytują rozwijające się dane z wyższych interwałów, więc ich komórki mogą się zmieniać do momentu zamknięcia tych słupków. Traktuj je jako żywy obraz aktualnej sytuacji, a nie jako zapis tego, co się wydarzyło.


USTAWIENIA


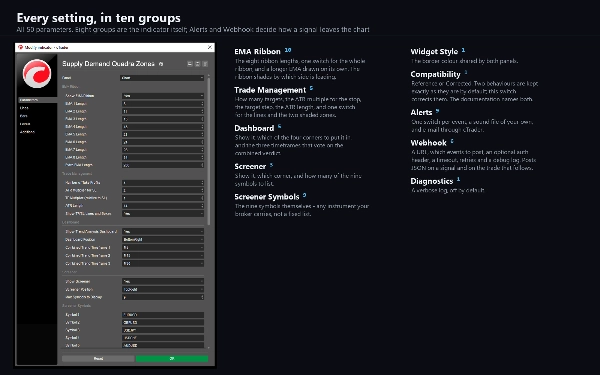
50 parametrów. Wszystkie osiem długości wstęgi, mnożnik ATR i odstępy celów, liczba celów, pozycje obu paneli, wszystkie dziewięć symboli skanera, trzy interwały panelu, kolor obramowania, kanały alertów i webhook. Ustawienie Kompatybilności wybiera między dwoma zachowaniami opcji panelu 4-godzinnego i zacienionej strefy celów – dokumentacja dokładnie wyjaśnia, co każde z nich robi i dlaczego domyślne ustawienie jest takie, jakie jest.


PRZEZNACZONE DLA


Dowolnego instrumentu i dowolnego interwału czasowego oferowanego przez platformę. Wstęga potrzebuje 34 słupków, aby być w pełni uformowana, a linia odniesienia 200, więc bardzo krótkie historie pokażą mniej linii niż długie.


Trading wiąże się z ryzykiem. Wyniki z przeszłości nie gwarantują wyników w przyszłości.

Podsumowanie

AI summary
Supply Demand Quadra Zones is a trading indicator designed for use on any instrument and timeframe supported by the platform. It features an eight-line Exponential Moving Average (EMA) ribbon (periods 5, 11, 15, 18, 21, 24, 28, 34) that visually signals trend direction by changing color: blue when the fast leg leads and grey otherwise, alongside a 200-period reference line. Buy and sell signals are generated when the second EMA crosses the eighth EMA, with entry points marked on the chart.

Each trade signal includes a comprehensive risk plan displayed directly on the chart, consisting of an entry line, a stop loss set at a multiple of the Average True Range (ATR), and up to four take-profit levels spaced by multiples of the stop distance. These levels are visually shaded and labeled with price tags for clarity. The risk plan dynamically tracks price movement and freezes upon trade resolution.

The product also includes two panels: a screener monitoring up to nine user-selected symbols on the current timeframe, classifying them as Long, Short, Bullish, or Bearish; and a trend dashboard showing directional trends across five timeframes (5m, 15m, 30m, 1h, daily) with a combined status based on a majority vote of three user-chosen timeframes.

Signals and trade steps can be sent as JSON via webhook to external services for automation or logging. Alerts are available through platform logs, sound, and email. Buy and sell signals are confirmed on closed bars and do not repaint, while the screener and dashboard update live and may change until bar close. The indicator offers extensive customization with 50 parameters covering ribbon settings, ATR multiples, target spacing, panel positions, symbols, alert channels, and webhook configuration.

Profil wskaźnika
Kategoria wskaźnika
Trend
Typ wyjścia
Sygnały
Wymagania dotyczące danych
Tylko słupki
Obsługiwane sygnały
Przecięcie

Opinie klientów

0.0
Opinie: 0
Opinie klientów
Ten produkt nie ma jeszcze opinii. Wypróbowałeś(-aś) go już? Bądź pierwszy(-a) i powiedz o tym innym!

Dyskusja

Częste pytania

EMA
Key Levels
Supply & Demand
ATR
Produkty dostępne za pośrednictwem cTrader Store, w tym boty handlowe, wskaźniki i wtyczki, dostarczane są przez deweloperów zewnętrznych i udostępniane wyłącznie w celach informacyjnych oraz w celu zapewnienia dostępu technicznego. cTrader Store nie jest brokerem i nie zapewnia doradztwa inwestycyjnego, nie udziela spersonalizowanych rekomendacji ani nie gwarantuje przyszłych wyników.

Więcej od tego autora

Wskaźnik
ATR
CCI
+4
A trend line that never steps back, a shaded band to the price, and a pointer at the swing where the trend turns.
Wskaźnik
ADX
ATR
+5
EMA-cross signals scored on six confluence layers, with an ATR stop, three targets and a live panel
Wskaźnik
ATR
EMA
+3
EMA cross filtered by a trend average and its ATR channel, with long, short and close marks and colored candles.
Wskaźnik
ATR
RSI
+4
Adaptive Ichimoku with nine-factor confluence scoring, five signal types, smart TP/SL and an MTF panel.
Wskaźnik
ATR
RSI
+5
Fusion trend line with a layered cloud, BULL and BEAR labels, scored re-entry triangles and exit markers.
cBot
Balanced
Fixed Lot
+5
Gold grid cBot for XAUUSD H1: four-signal confluence on closed bars, ladders closed at a basket profit, news filter
15.6%
ROI
2.33
Współczynnik zysku
Wskaźnik
ATR
Volume
+3
Fibonacci trend signals on closed bars, with an ATR stop, up to four targets and a break-even ladder.
Wskaźnik
ATR
RSI
+4
RSI bands drawn on price, confluence-scored BUY/SELL signals, an ATR stop with three targets
cBot
TP Manager
Break Even
+5
Gold cBot for prop-firm accounts: pick your firm, phase and size; risk is sized from the firm's rules, its limits kept
1.6
Współczynnik zysku
Wskaźnik
ADX
ATR
+5
Ten confluence layers scored on every closed bar, with an anti-chop gate, pivot levels and a live dashboard.
Wskaźnik
ADX
ATR
+5
SuperTrend signals scored on five confluence factors, with an ATR stop, three targets and a dashboard.
cBot
Channel
Fixed Lot
+5
Gold breakout cBot for XAUUSD M1: H4 high/low channel, RSI veto, one recovery step and a max drawdown close-all
20%
ROI
4.42
Współczynnik zysku

Możesz także polubić

Wskaźnik
ATR
RSI
+6
Market structural patterns , specifically the concepts of Change of Character (ChoCH) 🔄 and Break of Structure (BoS) 💥
Wskaźnik
SMC
Forex
+15
Smart institutional order block & FVG scanner with alerts, zone merging, and HTF confluence.
Wskaźnik
AI
ATR
+20
Algorithmic trend precision for cTrader.
Wskaźnik
Prop
Forex
+4
Universal multi time frame 'Moving Average' indicator with extended features
Wskaźnik
Zero Lag MACD delivers ultra-responsive trend and divergence signals with minimal lag, empowering timely Forex entries.
Logo „Average Cost Price”
Najwyżej oceniane
4.5
(4)
$25
/
$39
Wskaźnik
Prop
Forex
+9
Average Cost Price helps you keep track of your open positions on the chart. In doing so, it provides lines and explanat
Wskaźnik
RSI
VegaXLR's cTrader StochRSI identifies overbought/oversold RSI levels for precise trade entries.
Wskaźnik
ICT ALL KİLL ZONES, LONDON , ASİA, NY AM, NY LUNCH, NY PM
Wskaźnik
AI
Prop
+14
Professional Trading Indicator Transform Your Trading with Intelligent Signal Detection RenkoProfit
Wskaźnik
Forex
BTCUSD
+12
🎯Automatically identifies the market's significant turning points (key H & L) and draws dynamic support and.....✍️
Wskaźnik
Volume
Custom range volume profile between two draggable anchors. Auto source timeframe, Total/Up-Down/Delta, POC, Value Area.
Wskaźnik
Drawdown Monitor
Proprietary trading desk risk monitoring dashboard!
Wskaźnik
SMC
NAS100
+5
Rolling Volume Profile MTF with 24H, 7D, 30D profiles and a precise NY Open marker.
Wskaźnik
ADX
ATR
+5
EMA-cross signals scored on six confluence layers, with an ATR stop, three targets and a live panel
Wskaźnik
Channel
Imbalance
+2
Adaptive volatility channel based on moving average and standard deviation (σ).
Wskaźnik
Forex
Flexible Volume Profile, designed with performance in mind.
Wskaźnik
RSI
MACD
This indicator is a combination of MACD and RSI into one. This is perfect fusion and powerful indicator ever.
Wskaźnik
Overlay HTF context on any chart: color bars by HTF and draw filled HTF bodies with optional High/Low lines.

Cena

12
Sprzedaż
197
Bezpłatne instalacje