
Description
SMC Algo Warrior reads market structure the way smart money traders do. It finds swing highs and
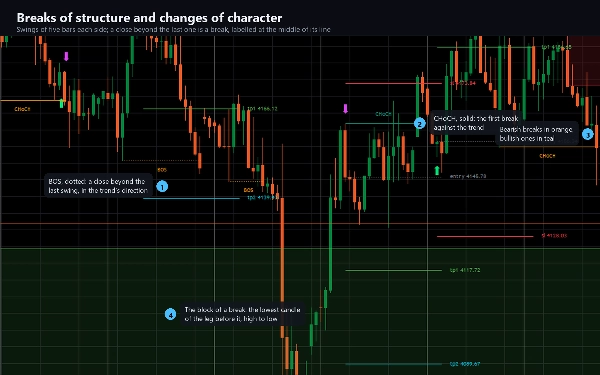
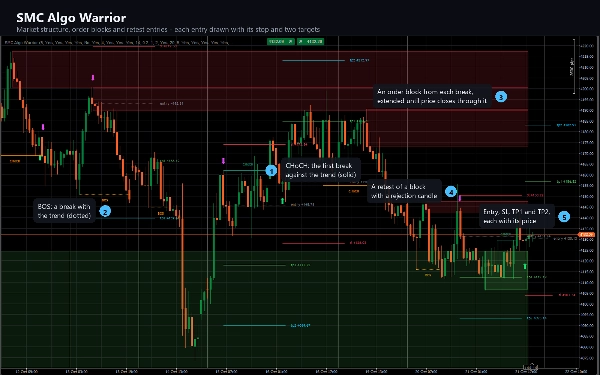
lows, marks every break of them as a break of structure (BOS) or a change of character (CHoCH), draws
an order block from the candle behind each break, and prints a buy or sell arrow when price returns to
an order block and rejects it. Every arrow arrives with an entry, a stop loss and two take-profit
levels.
WHAT IT DRAWS
- Break lines: a dotted line labelled BOS when a break continues the structure, a solid line labelled
CHoCH when it reverses it. Upward and downward breaks each have their own colour.
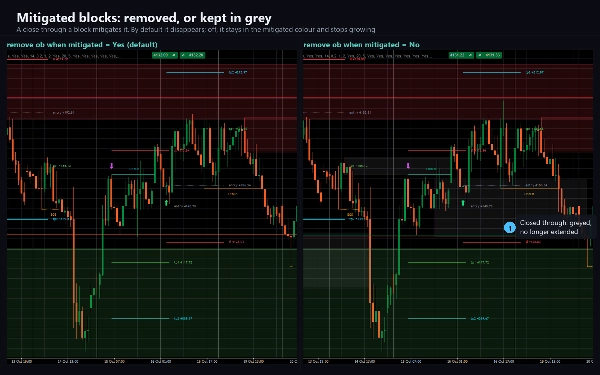
- Order blocks: a box over the candle with the lowest low before an upward break, or the highest high
before a downward one, extended to the right while it stays valid. A close through a block
mitigates it: by default the block is removed; if you keep mitigated blocks, it turns grey and no longer
extends.
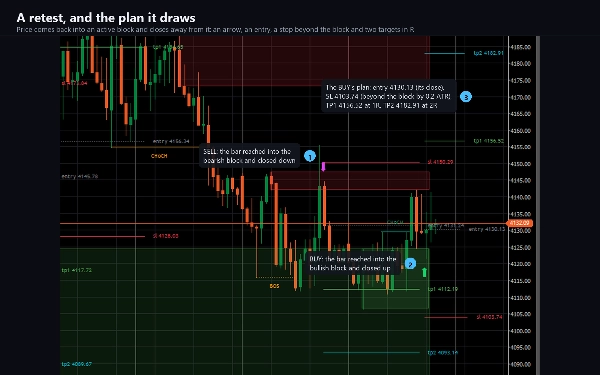
- Arrows: an up arrow under the bar for a buy, a down arrow over the bar for a sell.
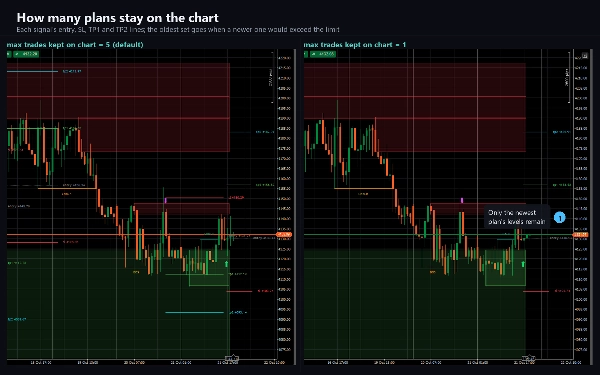
- Levels for every arrow: an entry line at the close, a stop line, and TP1 and TP2 lines, each with a
price tag, running twenty bars to the right by default. The five most recent sets stay on the chart.
HOW IT DECIDES
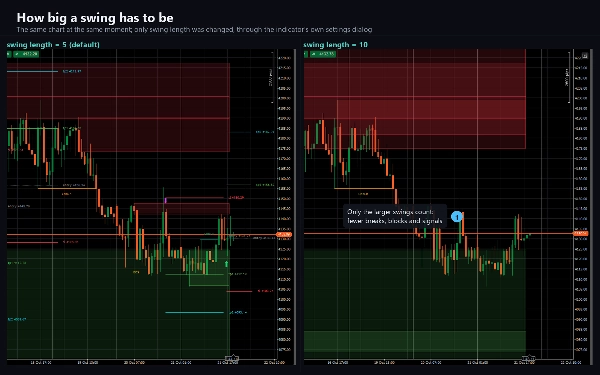
A swing high is a bar whose high is not exceeded by the five bars before it and is higher than each of
the five after it; a swing low is the mirror image. Five is the swing length, and a swing is confirmed
five bars after its own bar. An upward break is the first close above the last unbroken swing high, a
downward break the first close below the last unbroken swing low. A break against the current
structure is a CHoCH and turns it; a break in its direction is a BOS.
The order block of an upward break is the candle with the lowest low since the last swing low, at most
100 bars back; for a downward break, the candle with the highest high since the last swing high. Up to
four blocks of each side stay active, and older ones are removed.
A buy prints when a bullish block is retested: a later bar reaches down into the block, closes as a
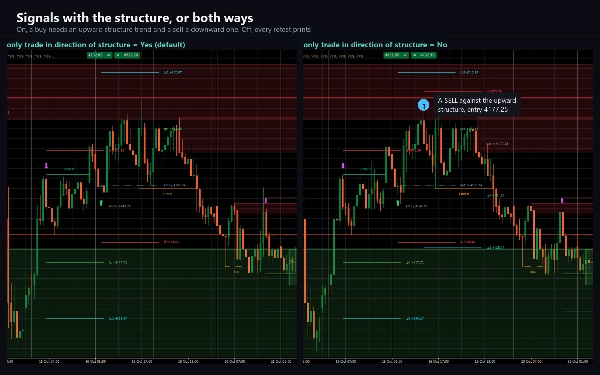
bullish candle and does not close below the block. A sell is the mirror image. With the structure
filter on, which is the default, a buy needs a bullish structure and a sell a bearish one. Each block
gives at most one signal, and each bar at most one buy and one sell.
The stop sits below the lower of the block's low edge and the signal bar's low, plus a 0.2 ATR
buffer (above the higher of the two for a sell). TP1 and TP2 sit at one and two times that risk from the
entry. All of it is adjustable.
Everything is decided when a bar closes. Nothing is drawn on the forming bar, and an arrow never
disappears once it has printed.
KEY SETTINGS
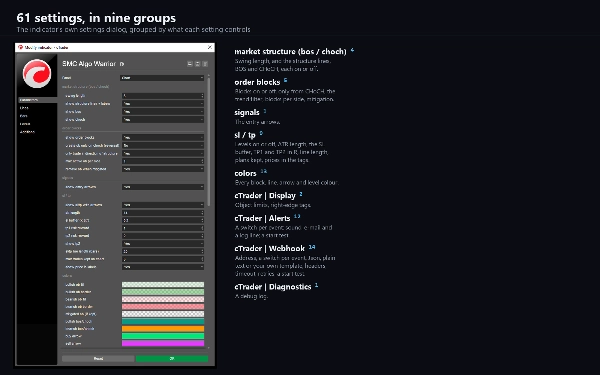
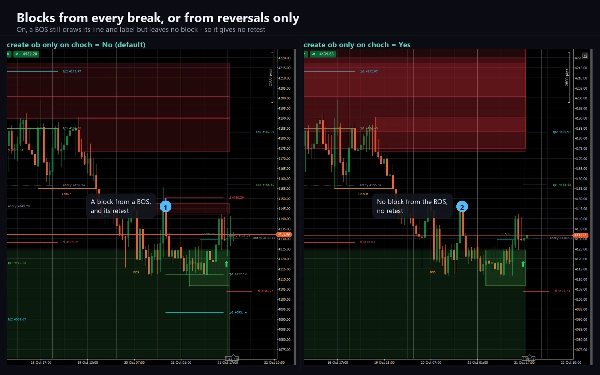
61 settings in nine sections: the swing length and which breaks to draw; order blocks on every break or
only on a CHoCH, the structure filter, how many blocks stay active and whether a mitigated block is
removed or kept; the arrows; the ATR length, the stop buffer, the two risk-reward multiples, the second
target on or off, how many bars the levels run, how many sets stay and whether the tags show prices;
thirteen colours;
and groups for display, alerts, the webhook and diagnostics.
ALERTS AND WEBHOOK
Four events, each with its own switch: buy, sell, bullish CHoCH and bearish CHoCH. Delivered as a log
line, a sound of your choice and e-mail, and a test on start checks your settings without waiting for
a signal. Nothing fires while the indicator walks the chart's history, and nothing fires in a backtest.
A webhook posts the same four events, each with its own switch, to any address you enter: a trading
bot, a journal, a relay, an automation flow. Choose a JSON body with the prices, the structure trend
and the trade levels, the plain alert sentence, or your own template with seventeen placeholders. Add
an authorisation header and one more header of your own. A post that gets no success answer is sent
again, and a test on start checks the address. It stays off until you enter one, it is sent once per
event per bar, capped at twenty messages a minute, and a failure is logged rather than thrown. It
sends through cTrader's own networking service, which is why the indicator needs no file or network
access rights at all.
TYPE AND WINDOW
An overlay indicator: everything is drawn on the price chart, and it adds no separate pane.
TIMEFRAMES AND INSTRUMENTS
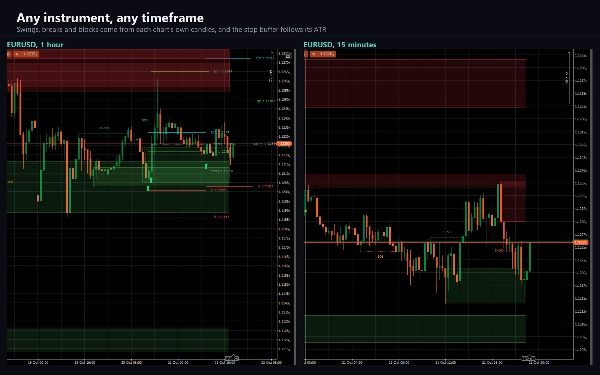
Any timeframe from one minute to daily and any instrument. Swings and breaks are read from the chart's
own bars, the stop buffer is measured in that chart's ATR, and prices are written to your broker's own
tick. Higher timeframes show the larger structure, lower ones more breaks and more retests; it was
checked most on M5, M15 and H1. When it attaches, the indicator loads at least 5,000 bars of the
chart's history so the structure has a past to build on.
USE CASES
- Reading market structure at a glance: which way it runs and where it last turned.
- Marking order blocks as zones to watch for a return.
- Taking retests only in the direction of the structure.
- Planning each trade in advance: entry, stop and two targets drawn when the arrow prints.
- Being told by log line, sound, e-mail or webhook when the structure turns or a retest prints.
WHO IT IS FOR
Traders who work with smart money concepts - structure, BOS, CHoCH and order blocks - and want them
drawn consistently by fixed rules, and anyone who wants a retest signal to come with a stop and
targets rather than an arrow alone.
TRIAL
The free trial is the full indicator on EURUSD only - every broker suffix works. On any other symbol
it shows a notice and draws nothing. No time limit, no reduced history, no missing features. The full
version removes the symbol restriction and changes nothing else.
TECHNICAL NOTES AND LIMITATIONS
Access rights: none. The indicator cannot read files, start processes or open connections of its own.
It is a charting and analysis tool. It does not place orders and it has no access to your account.
The levels are a plan drawn when the arrow prints. The indicator does not follow them or report
whether they are reached. Swings come from your broker's candles, so another feed with other highs
and lows can draw other structure. By default the chart keeps the newest 500 lines, 500 labels and
200 boxes, so the oldest structure retires on a long chart; a switch keeps all of it. Five outputs -
buy, sell, both CHoCH events and the structure trend - let a cBot read the signals.
SUPPORT
Questions go through the Discussion tab. Include your broker, symbol, timeframe, cTrader version and
a screenshot of the full chart, and you will get a useful answer first time.
Trading involves risk. Past performance does not guarantee future results.