


Descripción
Flux Gate Precision lee el rango en el que el mercado realmente ha operado y te indica cuándo el precio se compromete a uno de sus extremos.
Cómo encuentra una señal
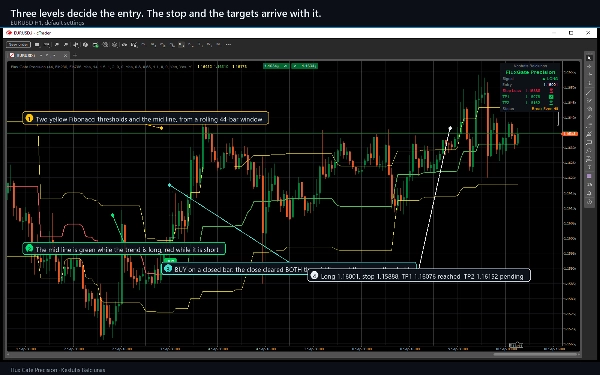
Una ventana móvil de las últimas 44 velas proporciona el máximo más alto y el mínimo más bajo. Se miden tres niveles desde ese máximo: un umbral superior de Fibonacci en 23.6 por ciento, una línea media en 50 por ciento y un umbral inferior en 78.6 por ciento. El indicador dibuja los tres y colorea la línea media de verde mientras la tendencia es alcista y de rojo mientras es bajista.
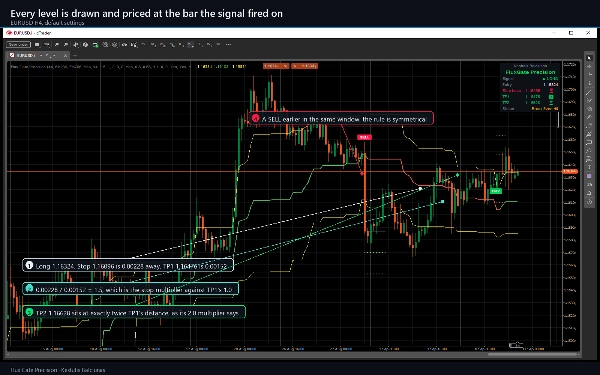
Una COMPRA necesita que una barra cierre por encima de AMBOS, la línea media y el umbral superior. Una VENTA necesita un cierre por debajo de AMBOS, la línea media y el umbral inferior. Requerir dos niveles en lugar de uno es lo que mantiene el indicador silencioso mientras el precio oscila alrededor del centro del rango. También debe cambiar el estado de la tendencia: no imprimirá una segunda COMPRA hasta que haya intervenido una VENTA, para evitar un cúmulo de la misma señal en un solo movimiento.
Cada decisión se toma en una barra CERRADA. Un marcador nunca aparece y luego desaparece.
Qué viene con la señal
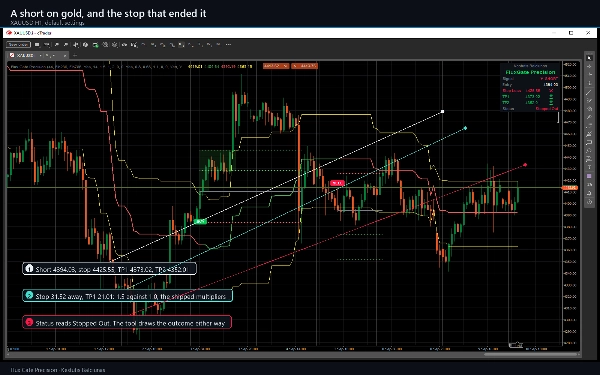
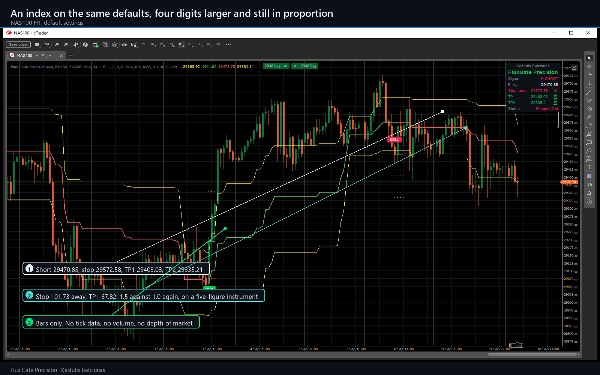
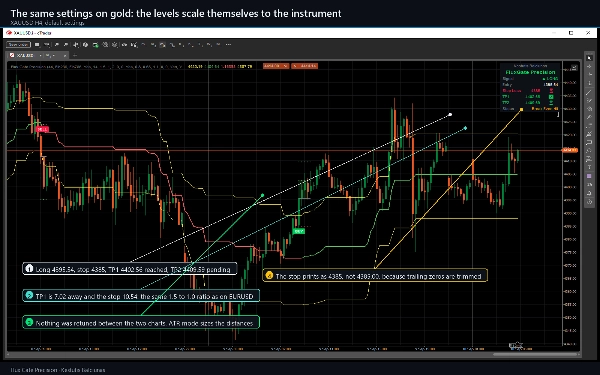
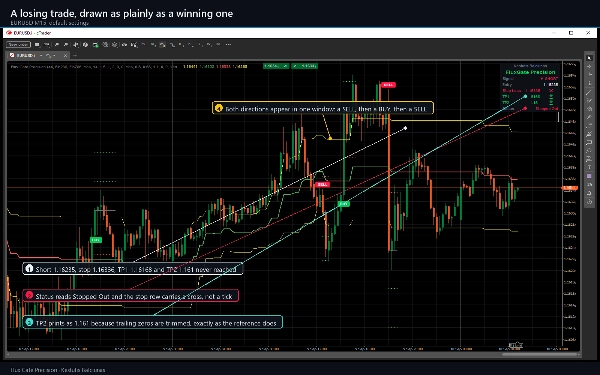
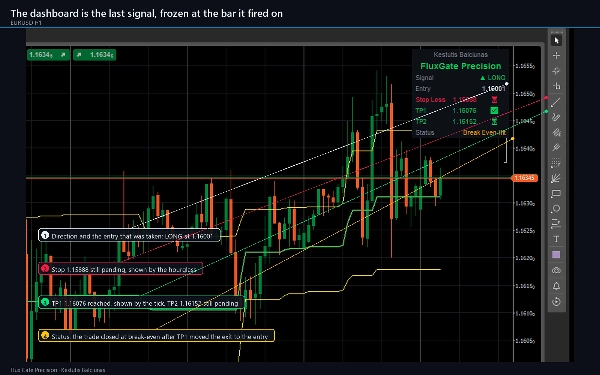
En el momento en que se imprime una señal, el indicador fija una entrada, un stop y hasta cuatro objetivos de beneficio, y dibuja cada uno como una línea etiquetada con su precio.
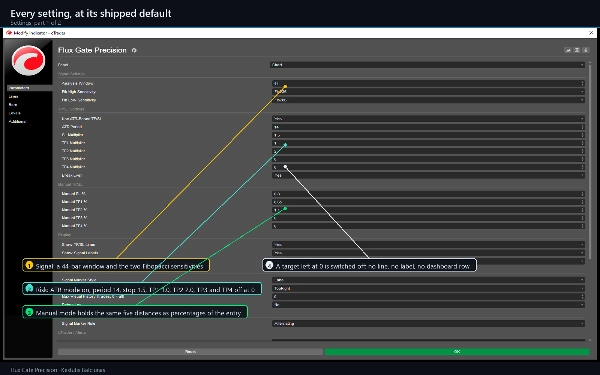
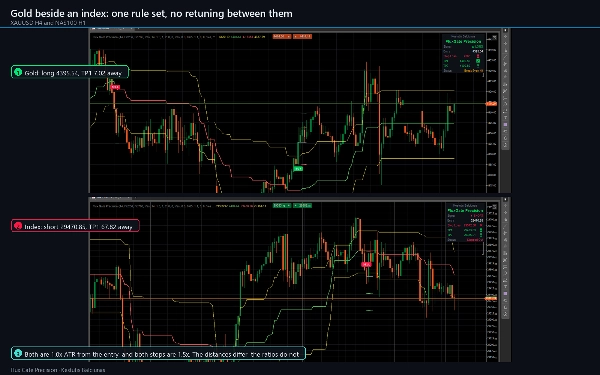
- El modo ATR, activado por defecto, dimensiona el stop y los objetivos según la volatilidad actual, por lo que los mismos ajustes se comportan de manera sensata en un gráfico de cinco minutos y en uno diario, así como en un par de divisas y en oro.
- El modo manual los dimensiona como un porcentaje fijo del precio de entrada en su lugar.
- El stop por defecto es 1.5 ATR, el primer objetivo 1.0 y el segundo 2.0. El tercero y cuarto están desactivados hasta que les asignes un multiplicador.
La escalera de punto de equilibrio
Con Break Even activado, la salida se mueve detrás de la operación: alcanzar el primer objetivo mueve el stop a la entrada, el segundo lo mueve al primer objetivo, el tercero al segundo, y alcanzar el cuarto cierra la operación. Se dibuja una banda sombreada cada vez que se alcanza un nivel, para que toda la vida de una operación permanezca legible en el gráfico después.
El panel de control
Un panel en la esquina que elijas muestra la última señal y lo que ha ocurrido desde entonces: dirección, entrada, stop, cada objetivo activo con una marca cuando el precio lo alcanza, y una línea de estado que indica Activo, Todos los TP Alcanzados, Stop Perdido, Punto de Equilibrio Alcanzado o Cambio de Tendencia.
Alertas
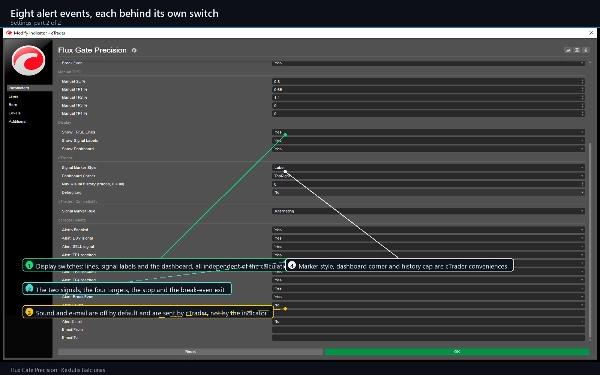
Ocho eventos, cada uno con su propio interruptor: las dos señales, los cuatro objetivos, el stop y la salida en punto de equilibrio. Cada uno se activa una vez por barra cerrada y nunca para el historial, por lo que adjuntarlo a un gráfico largo no produce una avalancha de alertas antiguas. La entrega es en el registro de cTrader, un sonido opcional y correo electrónico opcional a través de tus propias configuraciones de cTrader.
Configuraciones
38 parámetros en cuatro grupos que usarás y tres que probablemente no tocarás: la ventana de análisis y las dos sensibilidades de Fibonacci, el modo ATR y sus multiplicadores, los porcentajes manuales y tres interruptores de visualización. El resto son comodidades de cTrader: un estilo de marcador, la esquina del panel, un límite visual de historial, un registro de depuración y un interruptor por alerta.
Tipo, marcos temporales e instrumentos
Un indicador superpuesto para análisis de tendencia y soporte y resistencia. Necesita unas 60 barras antes de dibujar, lo cual es poco, por lo que es usable en gráficos intradía así como en gráficos de oscilación. M15, H1 y H4 son la ventana para la que fue diseñado; funciona en cualquier marco temporal y cualquier instrumento, y ha sido probado en pares principales de FX, oro e índices. Usa solo barras: no datos de ticks, ni volumen, ni profundidad de mercado.
Para quién es
Traders que quieren una regla de entrada que puedan expresar en una sola frase, y que desean que el stop y los objetivos se decidan al mismo momento que la entrada y no después.
La prueba
La edición de prueba es esta misma versión con una restricción: funciona solo en EURUSD, y se aceptan sufijos de broker como EURUSD.i. No hay límite de tiempo y todos los parámetros están disponibles. La versión completa añade todos los demás símbolos.
Notas técnicas
Las señales no se repintan: se evalúan solo en barras cerradas. Mientras una operación está abierta, sus líneas de nivel y sus etiquetas se extienden hacia la derecha con el gráfico, lo que mueve el dibujo, no los niveles. Durante las primeras barras de la ventana ATR, el stop y los objetivos se mantienen en el precio de entrada hasta que el promedio tiene suficientes datos, y un objetivo dejado con un multiplicador cero está desactivado y no recibe línea, etiqueta ni fila en el panel.
El indicador no declara derechos de acceso. No abre conexiones de red, no lee archivos y nunca coloca, modifica ni cierra una orden. Las marcas en el panel registran que el precio tocó un nivel dibujado en el historial cargado, sin spread, comisión ni deslizamiento.
Soporte
Las preguntas se realizan a través de la pestaña de Discusión de este listado. Por favor incluye tu símbolo, marco temporal, broker, versión de cTrader y una captura de pantalla con el panel visible.
El trading implica riesgos. El rendimiento pasado no garantiza resultados futuros.
Resumen
Upon signal generation, the indicator sets entry, stop-loss, and up to four take-profit levels, which are displayed as labeled lines on the chart. The stop and targets can be sized using ATR-based volatility or fixed percentage modes. The break-even ladder adjusts the stop progressively as targets are reached, visually marking each level on the chart.
A dashboard panel shows the latest signal status, including entry, stop, targets, and trade progress. Alerts can be configured for signals, targets, stops, and break-even exits, firing once per closed bar. The indicator works on any timeframe and instrument using bar data only and is suitable for intraday and swing trading. It has been tested on major FX pairs, gold, and indices.















![Logotipo de "Gaussian Channel [Iridio Capital]"](https://cdn.ctrader.com/image/webp/2c4f9ca9-4e9b-476d-b5a6-787c8095032b_61546)












