


Descripción
KUMO FORGE PRO
Un sistema Ichimoku cuyos períodos se adaptan a la volatilidad, con cada señal puntuándose sobre 100 antes de ser
dibujada.
LO QUE PONE EN TU GRÁFICO
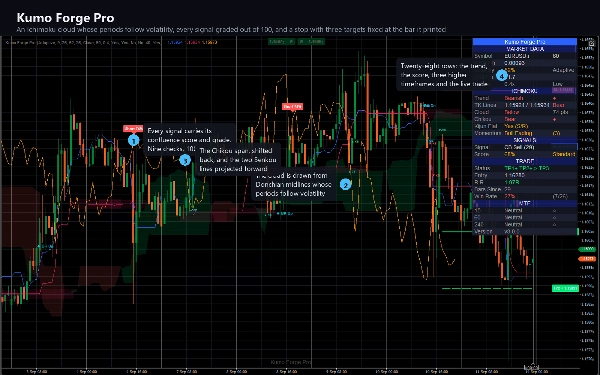
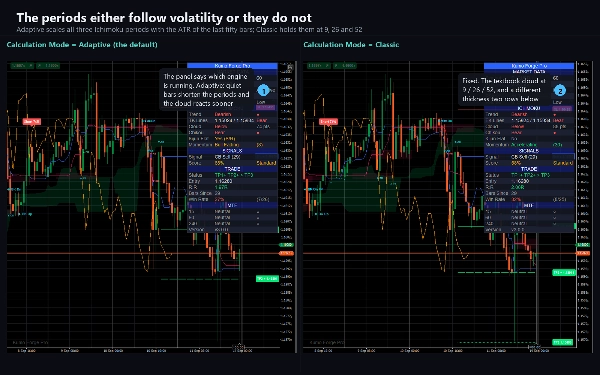
La imagen completa de Ichimoku - Tenkan-Sen, Kijun-Sen, la nube Kumo y el Chikou span - con una
diferencia respecto a la versión de libro de texto: en modo Adaptativo los tres períodos se estiran y comprimen con
la volatilidad medida, por lo que la nube reacciona más rápido en un mercado rápido y más lento en uno tranquilo. El modo clásico
te da el fijo 9 / 26 / 52 si lo prefieres.
Además de eso:
- Placas de señal que indican Largo o Corto con la puntuación de confluencia en ellas.
- Marcadores de ruptura y retesteo de Kumo, marcadores de rebote en Kijun y en el borde de la nube, y marcadores de ruptura de Chikou.
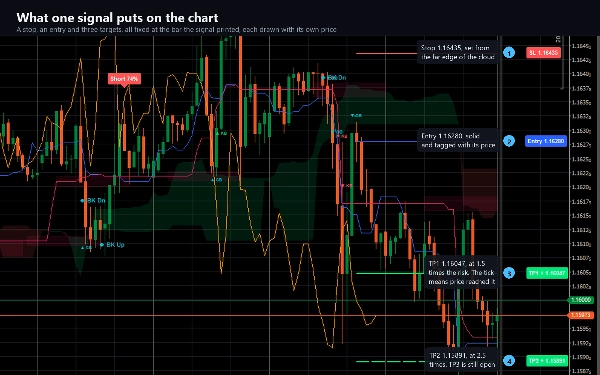
- Un dibujo completo de la operación tras cada señal: la entrada, un stop y tres niveles de toma de ganancias, cada uno
una línea etiquetada con su propio precio.
- Zonas de soporte y resistencia dibujadas dondequiera que la Kijun-Sen se aplana.
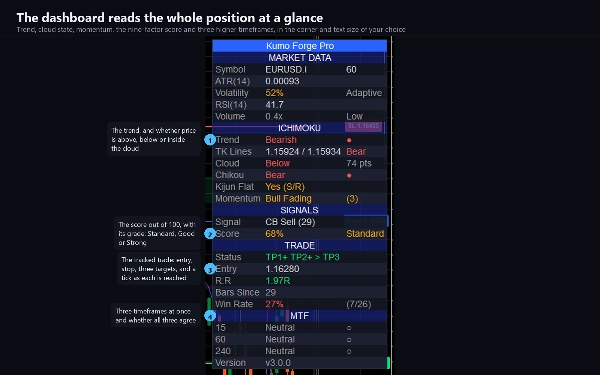
- Un panel de hasta 28 filas: ATR, volatilidad, RSI, volumen, tendencia, los valores de las dos líneas, estado y
grosor de la nube, Chikou, momentum, la señal y su grado, el estado en vivo de la operación, R:R, y un
panel de alineación de tres marcos temporales.
CÓMO FUNCIONA LA PUNTUACIÓN
Nueve factores, cada uno con un valor fijo de puntos: precio contra la nube (20), las dos líneas alineadas
(15), acuerdo de Chikou (15), dirección de la nube (10), grosor de la nube (8), volumen (10), momentum (12),
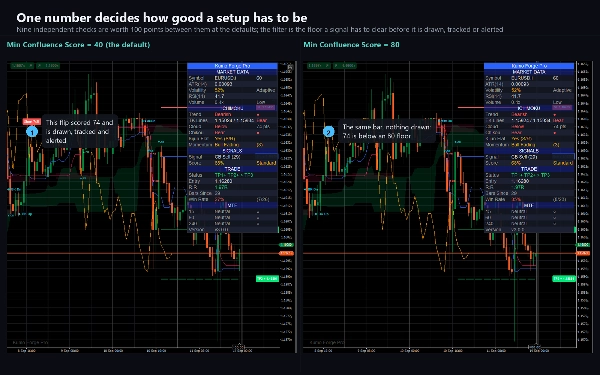
aceleración del momentum (10), y opcionalmente RSI (10). Una señal debe alcanzar la Puntuación Mínima de Confluencia - 40 de
100 por defecto - antes de ser dibujada. Súbela para menos señales pero mejores; bájala para más.
Dos de los nueve no dependen de la dirección, así que una nube delgada con bajo volumen reduce tanto la puntuación alcista como la bajista,
y nada se activa en ninguna dirección. Eso es intencional: es el mercado diciéndote que no hay nada ahí.
CINCO TIPOS DE SEÑALES, TODAS EN BARRAS CERRADAS
1. Cruce Tenkan/Kijun, el disparador clásico, con la puntuación en la placa.
2. Rebote en Kijun - el precio baja a la línea base y cierra por encima de ella en una tendencia alcista.
3. Rebote en el borde de la nube - la misma idea contra el límite de la nube.
4. Ruptura de Kumo, con un requisito de volumen, más un marcador de retesteo cuando el precio vuelve al borde roto.
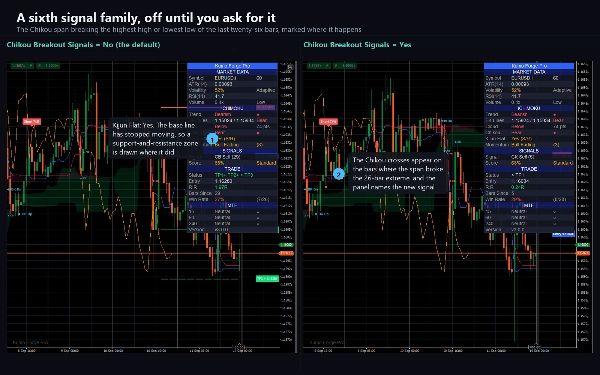
5. Ruptura de Chikou, la confirmación más retrasada, desactivada por defecto.
Cada señal se evalúa en una barra cerrada y nunca se mueve una vez que esa barra ha cerrado.
EL MOTOR INTELIGENTE DE TP/SL
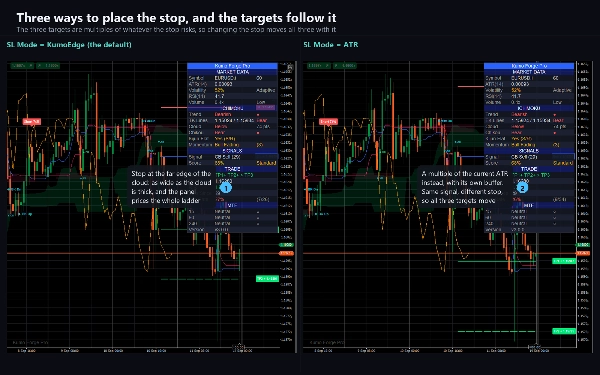
Después de cada señal dibuja una entrada, un stop y tres objetivos. El stop proviene del borde de nube más cercano,
la línea Kijun, o un múltiplo directo de ATR - tu elección - y los tres objetivos son múltiplos de riesgo
de este, 1.5R, 2.5R y 4R por defecto. El panel rastrea cuáles han sido alcanzados y muestra el
R:R en vivo de la idea abierta.
EL PANEL MULTI-TIMEFRAME
Tres marcos temporales - M15, H1 y H4 por defecto, cualquiera tres que prefieras - cada uno reportando alcista, bajista o
neutral desde la misma prueba Ichimoku, además de si los tres están de acuerdo. Una fila de marco temporal superior se asienta cuando
esa barra del marco temporal cierra.
ALERTAS
Veintitrés eventos a través de trece interruptores: ambos cruces, ambas rupturas, ambos retesteos, ambos rebotes en Kijun, ambos rebotes en la nube, ambas rupturas de Chikou, cada uno de los tres objetivos, el stop, los dos eventos de alineación, los tres cambios de tendencia y los dos eventos de señal fuerte. Cada uno va al registro de cTrader, un sonido
y un correo electrónico, con un cuerpo JSON disponible para cualquier cosa que lea tu registro.
CONFIGURACIONES CLAVE
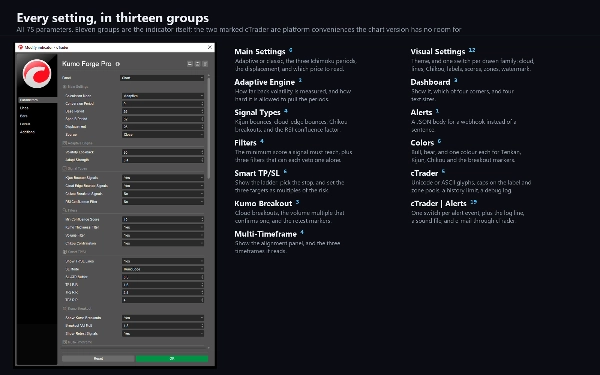
El Modo de Cálculo elige Adaptativo o Clásico. Los tres períodos Ichimoku y el desplazamiento son todos
ajustables. La Puntuación Mínima de Confluencia es el único dial que cambia cuánto dibuja. El Modo SL y los tres
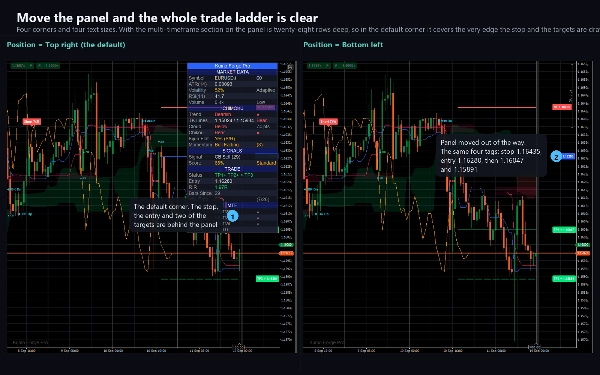
múltiplos R:R moldean el dibujo de la operación. Cada elemento visual tiene su propio interruptor, el panel tiene cuatro
posiciones y cuatro tamaños de texto, y los seis colores son tuyos.
Setenta y cinco parámetros en total, cada uno documentado, con valores predeterminados que funcionan en el primer gráfico en el que lo pongas.
TIPO DE INDICADOR Y VENTANA
Un indicador superpuesto: dibuja sobre el gráfico de precios, no en un panel separado. Solo lee barras y volumen de ticks.
MARCO TEMPORAL E INSTRUMENTOS PREFERIDOS
M15 a H1 es donde los períodos 9 / 26 / 52 fueron diseñados para funcionar y donde el conjunto multi-timeframe predeterminado
se sitúa naturalmente sobre el gráfico. H4 y D1 dan señales menos frecuentes y más lentas con nubes más anchas. M1 y M5
funcionan pero producen muchas más señales - sube primero la Puntuación Mínima de Confluencia.
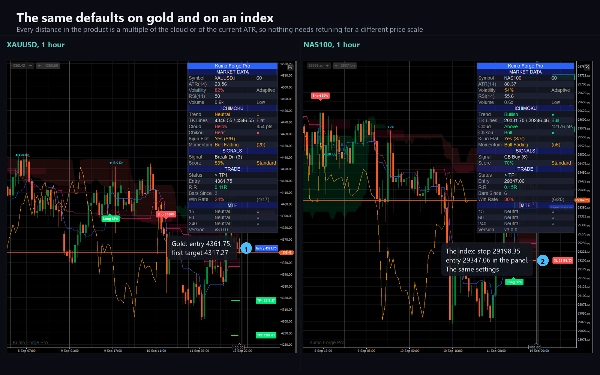
Construido y verificado en EURUSD; la lógica es independiente del símbolo y se usa en pares forex mayores y menores,
oro y plata, índices, petróleo y criptomonedas. El filtro de volumen necesita un símbolo cuyo feed incluya volumen de ticks, lo que hacen forex y CFDs.
PARA QUIÉN ES
Para traders que ya leen Ichimoku y quieren que la nube se adapte a un mercado cambiante, que la aritmética de confluencia se haga por ellos,
y que los niveles de operación se dibujen en lugar de medirse a mano. Es adecuado para trading swing e intradía en M15 y superiores.
LO QUE NO ES
No es un sistema automatizado. No coloca órdenes, no abre conexión de red ni lee archivos - no
declara derechos de acceso en absoluto, lo que puedes comprobar en los detalles del algoritmo.
LA PRUEBA
La prueba es el mismo producto restringido a EURUSD, con cualquier sufijo de broker aceptado. No hay límite de tiempo
y nada se retiene: los cinco tipos de señales, los cuatro filtros, el motor completo de TP/SL, las
zonas, el panel, el dashboard, las 23 alertas y los 75 parámetros. La versión completa añade todos los demás
símbolos.
NOTAS TÉCNICAS
cTrader Desktop 5.x. Las señales no se repintan. Las cinco líneas de operación se redibujan cada barra para que sigan
alcanzando el borde derecho, y las filas multi-timeframe se asientan cuando su propia barra cierra - ambos están
documentados en el paquete. cTrader muestra un margen derecho solo con Chart Shift activado, así que las etiquetas de precio están fijadas justo dentro del borde derecho.
SOPORTE
A través de la pestaña de Discusión en esta página. Por favor incluye tu broker, símbolo, marco temporal, versión de cTrader
y una captura de pantalla del gráfico completo incluyendo el panel.
El trading implica riesgos. El rendimiento pasado no garantiza resultados futuros.
Resumen
The indicator displays the full Ichimoku components—Tenkan-Sen, Kijun-Sen, Kumo cloud, and Chikou span—enhanced with nine-factor confluence scoring to evaluate signals out of 100 before plotting. It supports five signal types on closed bars: Tenkan/Kijun cross, Kijun bounce, cloud-edge bounce, Kumo breakout with retest, and Chikou breakout (optional).
Kumo Forge Pro automatically draws trade setups including entry, stop loss (configurable via cloud edge, Kijun line, or ATR), and three take-profit levels based on risk multiples. It also marks support/resistance zones where Kijun-Sen is flat.
A multi-timeframe panel displays Ichimoku signals across three user-selectable timeframes, indicating bullish, bearish, or neutral trends and their alignment. The dashboard provides up to 28 data rows covering volatility, momentum, volume, trend, and live trade status.
The indicator supports symbols with tick volume data, including major and minor forex pairs, metals, indices, oil, and crypto. It does not automate trading or place orders but offers extensive alerts and customization with 75 parameters.





























