
Descripción
📊 COT Indicator History Pro — Flujo y Dirección de Actores (Institucional / Coberturistas / Minoristas)
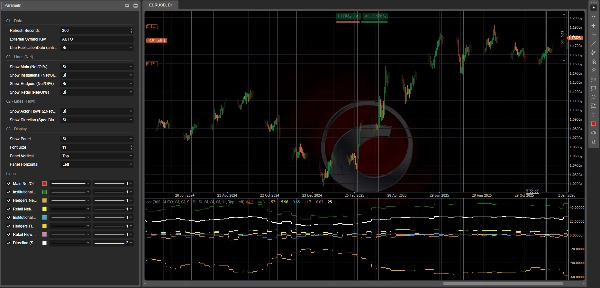
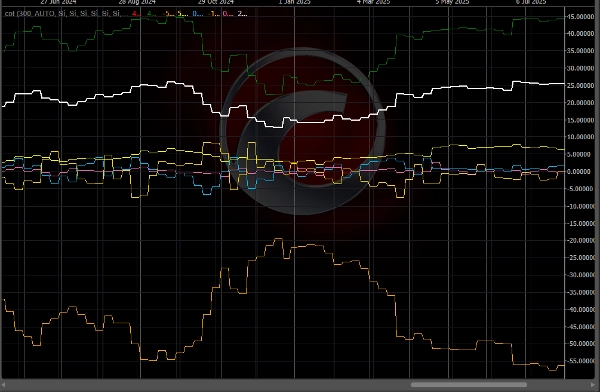
CotIndicatorHistoryPro ofrece una lectura avanzada de los Compromisos de los Comerciantes (COT) directamente en tu gráfico, con un desglose claro por participantes del mercado (Institucional, Coberturistas/Comercial, Minoristas).
Muestra no solo dónde está posicionado cada actor (predominantemente largo/corto), sino también qué están haciendo ahora mismo (aumentando largos o cortos), además de una línea sintética de Dirección para resaltar el sesgo predominante.
El indicador carga su conjunto de datos desde un feed JSON seguro (HISTORIA + SALIDA) y lo alinea de forma segura en el gráfico (opción anti-anticipación usando PublicationDate).
🗓️ Actualización Semanal de Datos (viernes 21:00)
El conjunto de datos COT se actualiza cada viernes a las 21:00 (hora Europa/Roma) gracias a una canalización de automatización dedicada:
un script de procesamiento sofisticado realiza los cálculos y publica los valores actualizados en el feed JSON usado por el indicador (y el ecosistema cBot relacionado si está instalado).
✅ El propio indicador se actualiza en la plataforma usando tu configuración de Segundos de Actualización y mostrará los nuevos datos semanales tan pronto como se publiquen.
✅ Lo Que Obtienes (Líneas + Panel)
🔥 Líneas de “Flujo” (3 Actores) — ΔNet/OI%
Estas líneas representan el cambio semana a semana en posiciones netas, normalizado por el Interés Abierto:
- 🔵 Flujo Institucional (ΔNet/OI%)
- 🟡 Flujo de Coberturistas / Comercial (ΔNet/OI%)
- 💗 Flujo Minorista (ΔNet/OI%)
📌 Cómo leerlo:
- Por encima de 0 ⇒ el actor está aumentando Net LONG (añadiendo largos y/o cubriendo cortos)
- Por debajo de 0 ⇒ el actor está aumentando Net SHORT (añadiendo cortos y/o reduciendo largos)
- Valores absolutos mayores (p.ej., ±1.5%, ±3%) ⇒ cambios de posicionamiento más fuertes y significativos
🧭 Línea de “Dirección” — Sesgo Especulativo Net/OI%
- ⚪ Dirección (Sesgo Especulativo) Net/OI% resume la dirección “especulativa” predominante (promedio de Institucional + Minorista, con respaldo si es necesario).
📌 Cómo leerlo:
- > 0 ⇒ Sesgo especulativo LARGO
- < 0 ⇒ Sesgo especulativo CORTO
- ≈ 0 ⇒ fase PLANA / neutral
🧩 Panel de Información (Contexto Completo)
Un panel incorporado muestra:
- 📄 Fecha del Informe / Fecha de Publicación
- 📌 Interés Abierto + Cambio WoW (semana a semana)
- 🎯 Señal de texto (si está disponible en SALIDA)
- Para cada actor:
-
- Sesgo (predominantemente LARGO / CORTO / PLANO) basado en Net
- Net/OI%
- Flujo (ΔNet/OI%)
- WoW ΔLong / ΔShort / ΔNet para entender cómo cambió la posición
🧠 Cómo Leerlo (Simple y Práctico)
✅ Flujo vs Sesgo (Diferencia Clave)
- Flujo = lo que están haciendo ahora (añadiendo largos o cortos)
- Sesgo = cómo están posicionados en general (predominantemente largo o corto)
Ejemplo:
- Institucional Sesgo LARGO + Flujo positivo ⇒ siguen empujando al alza
- Institucional Sesgo LARGO + Flujo negativo ⇒ reducción de largos / posible rotación
🚦 Escenarios Típicos de Trading
✅ Escenario A — Confirmación de Tendencia
- Dirección > 0
- Flujo Institucional > 0
➡️ La presión de compra es consistente: a menudo una configuración de continuación.
✅ Escenario B — Reversión Potencial (Dinero Inteligente vs Minoristas)
- Flujo Institucional > 0 mientras que el Flujo Minorista < 0
➡️ Los minoristas venden/cortan mientras las instituciones compran: posible acumulación.
(Lo contrario = posible distribución)
✅ Escenario C — Coberturistas como “Alerta”
- Coberturistas en niveles extremos (Net/OI lejos de neutral) + flujo fuerte
➡️ Posible zona de exceso / cobertura agresiva (a menudo mejor como advertencia que como disparador de entrada directa).
✅ Escenario D — “Carga” del Mercado (Riesgo de Ruptura)
- Flujo fuerte + Interés Abierto WoW en aumento
➡️ Nuevas posiciones están entrando: la probabilidad de movimientos extendidos a menudo aumenta.
⚡ Rutina de Lectura de 10 Segundos
- Verifica Dirección: LARGO (>0) o CORTO (<0)
- Verifica Flujo Institucional: ¿confirma o diverge?
- Verifica Flujo Minorista: ¿confirma o hace lo contrario?
- Verifica Interés Abierto WoW: ¿expansión o cierre de posiciones?
✅ Símbolos Soportados + Leyenda Clave (Claves de Símbolos JSON)
El indicador puede analizar cualquier instrumento disponible en el feed JSON (campo data[].symbol en SALIDA).
Cómo seleccionar el instrumento correcto
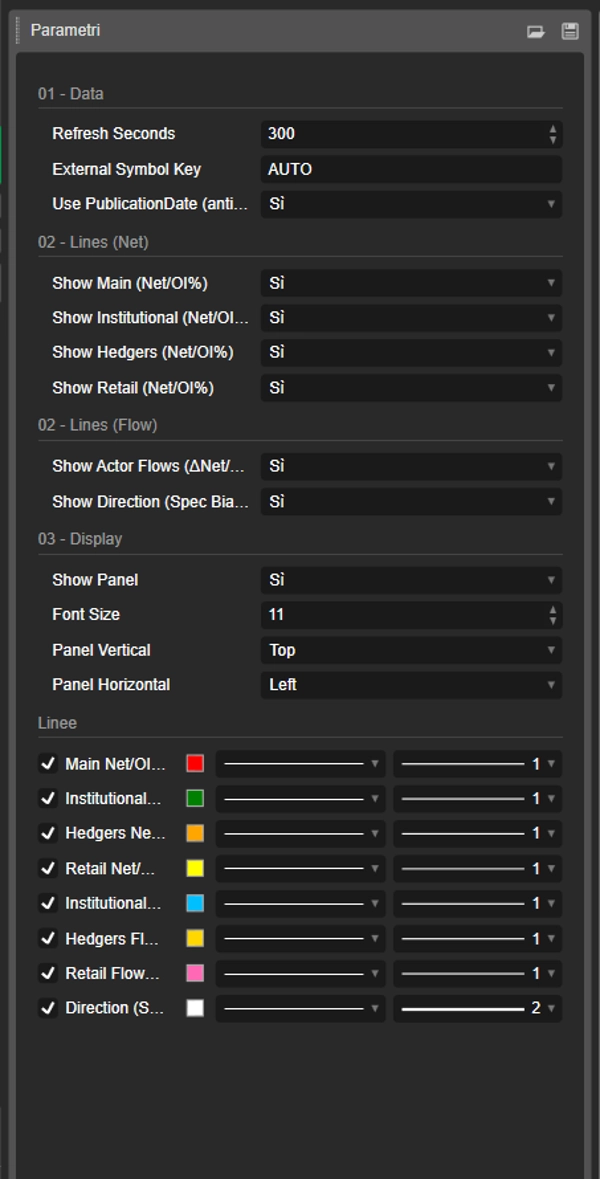
- Clave de Símbolo Externa = AUTO 👉 usa automáticamente el símbolo del gráfico (y elimina cualquier sufijo después de “.”, p.ej.,
US2000.ecn→US2000). - Si tu broker usa nombres de símbolos diferentes 👉 configura Clave de Símbolo Externa con la clave JSON exacta (sin distinguir mayúsculas/minúsculas).
Claves actuales en el feed (ejemplo de instantánea: reportDate 2026-02-17, publicationDate 2026-02-20)
- FX:
AUDUSD,EURUSD,GBPUSD,USDMXN - Índices:
US100,US2000,DOW30,VIX - Materias Primas/Metales/Agricultura:
BRENT,WTI,COPPER,CORN,WHEAT,XAU(Oro),XAG(Plata) - Cripto:
BTC,ETH
📌 Si no ves valores en el gráfico:
- verifica que el símbolo del gráfico coincida con una clave JSON
- configura Clave de Símbolo Externa manualmente (p.ej.,
ETH,US2000) - revisa el panel de Fecha del Informe/Publicación para confirmar que se cargó el conjunto de datos más reciente
⚙️ Notas
- Soporta una alineación más segura con Uso de PublicationDate (anti-anticipación) ✅
- Las líneas y el panel pueden activarse/desactivarse individualmente.
📌 Descargo de responsabilidad: indicador informativo solamente, no consejo financiero. Los datos COT son semanales y deben contextualizarse con la tendencia, niveles clave y volatilidad.
Resumen
The indicator sources data from a secured JSON feed updated every Friday at 21:00 (Europe/Rome time) and aligns it on the chart using publication dates to prevent lookahead bias. Users can view flow lines for each actor, a direction line indicating overall market bias, and an info panel detailing report dates, open interest, net positions, and weekly changes.
It supports a wide range of instruments including Forex pairs (e.g., EURUSD, GBPUSD), indices (e.g., US100, DOW30), commodities (e.g., Brent, Gold), and cryptocurrencies (BTC, ETH). Symbol selection can be automatic or manually set to match feed keys.
Typical use cases include trend confirmation, spotting potential reversals by comparing smart money and retail flows, hedger activity alerts, and breakout risk assessment based on open interest changes. The indicator is informational and designed to complement other technical analysis tools.
Valoraciones de clientes
5 | 50 % | |
4 | 50 % | |
3 | 0 % | |
2 | 0 % | |
1 | 0 % |