

Descripción
MTC INTERACTIV RAINBOW PRO
POR QUÉ ESTE ARCOÍRIS ES DIFERENTE
Los indicadores de arcoíris han existido durante años, hermosas bandas de medias móviles en el gráfico. El problema: casi nadie sabe realmente cómo leerlos o convertirlos en decisiones. Se ven geniales… y luego permanecen ahí, sin usar.
MTC Interactiv Rainbow Pro soluciona exactamente eso, de manera interactiva. En lugar de mirar docenas de líneas de colores y adivinar, trabajas CON el arcoíris: pasa el cursor, haz clic, enfócate, mide y deja que el gráfico se explique por sí mismo.
LO QUE VES
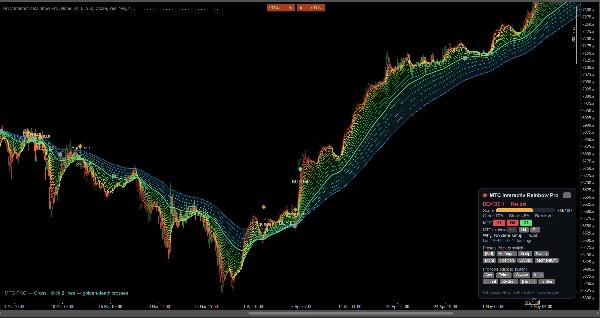
• Un arcoíris EMA denso y suave que muestra la dirección de la tendencia, la fuerza y el impulso de un vistazo.
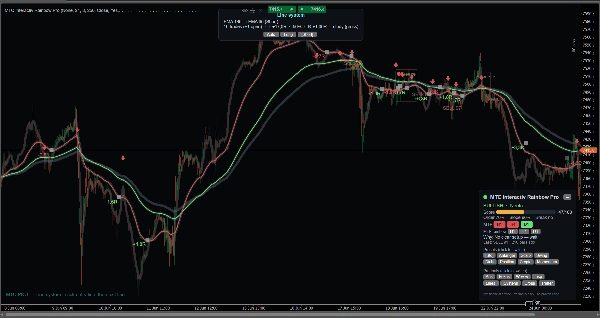
• Marcadores claros de COMPRA / VENTA / SALIDA y zonas de compresión/ruptura — todo en barras cerradas, sin repintado.
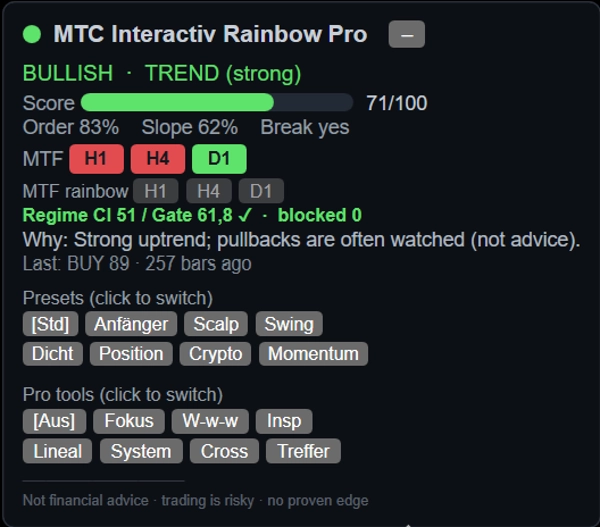
• Un panel compacto en vivo: dirección, una puntuación de fuerza de 0 a 100, lecturas de orden/inclinación/ruptura, consenso multitemporal y un "por qué" en lenguaje sencillo.
LO QUE LO HACE INTERACTIVO (la parte que nadie más te da)
• Pasa el cursor sobre cualquier línea para ver instantáneamente su período EMA — finalmente sabrás qué media estás mirando.
• Enfoca una sola línea y atenúa el resto para una vista limpia.
• Herramientas de "qué pasaría si" e inspección para estudiar cualquier barra o señal pasada.
• Una regla incorporada (ATR / R / pips).
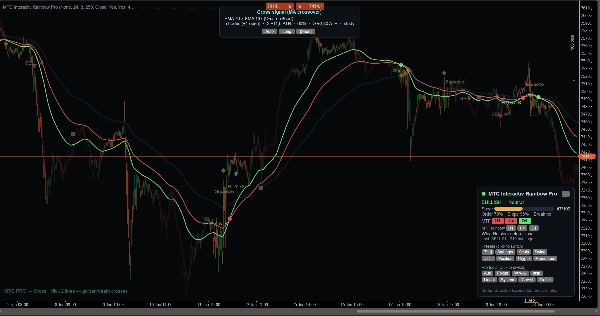
• Estudios de sistema de líneas y cruces para explorar cómo interactúan dos medias.
• Estudio de tasa de respeto: con qué frecuencia el precio realmente respeta una línea elegida.
• Superposición de arcoíris MTF con un clic: ve el arcoíris H1 / H4 / D1 en tu gráfico actual en gris.
• 8 preajustes con un clic (Principiante, Scalping, Swing, Posición, Cripto, Momentum, Denso, Estándar).
• Filtro de régimen opcional y una superposición de gestión de operaciones (stop estructural, banda de riesgo 1R, línea de seguimiento) para un pensamiento disciplinado sobre el riesgo.
CÓMO LEERLO
Abanico y ordenado = tendencia fuerte. Apretándose = enrollamiento, una ruptura está cerca. Flecha arriba/abajo = señal de ruptura. Cuanto más densa y ordenada esté la banda, más fuerte es el movimiento. Un tutorial interactivo incorporado (inglés y alemán) te guía paso a paso.
PARA QUIÉN ES
• Principiantes que siempre quisieron usar un arcoíris pero nunca supieron cómo — las herramientas interactivas te enseñan mientras avanzas.
• Comerciantes experimentados que quieren una lectura rápida y limpia de la tendencia, el impulso y el contexto multitemporal.
• Constructores de bots: una base de investigación transparente para tus propias estrategias y bots EMA / MA.
Funciona en cualquier símbolo y marco temporal; las herramientas interactivas brillan en M5–H4. Sin tamaño mínimo de cuenta — es una herramienta de análisis, no un autocomerciante.
IMPORTANTE — POR FAVOR LEE
Esta es una herramienta de análisis y aprendizaje, NO un consejo de inversión ni una garantía de ganancias. Todas las señales, puntuaciones y operaciones simuladas son observaciones, no una ventaja estadísticamente probada. El trading apalancado es riesgoso y puede llevar a la pérdida total. Siempre toma tus propias decisiones y prueba primero en una cuenta demo.
Resumen
Key features include an interactive interface allowing users to hover over lines to identify EMA periods, focus on individual lines, and use tools like "What-if" analysis, inspection of past signals, and a built-in ruler measuring ATR, price range, and pips. The indicator offers line-system and cross studies to analyze interactions between averages, a respect-rate study to assess price adherence to specific lines, and a one-click multi-timeframe rainbow overlay showing higher timeframe EMAs in grey.
A compact live dashboard provides a 0–100 strength score, order, slope, breakout readings, multi-timeframe consensus, and plain-language explanations. Eight one-click presets cater to various trading styles and markets, including scalp, swing, position, crypto, and momentum trading. Additional features include an optional regime filter and trade-management overlays for risk control.
Suitable for all symbols and timeframes, especially effective on M5 to H4 charts, this tool supports traders ranging from beginners learning to use EMA rainbows to experienced traders and bot developers seeking a transparent EMA research base.




















