

Description
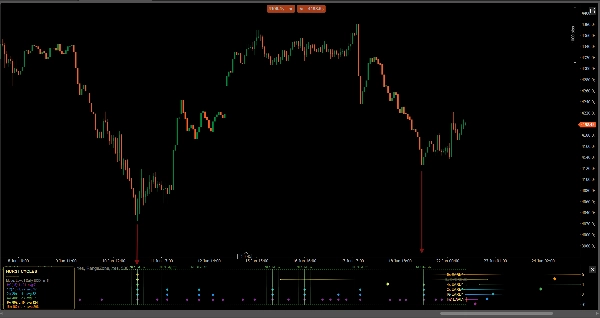
MTC Hurst Cycle Akademica cartographie la structure cyclique de tout marché, niveau par niveau, dans un sous-panneau dédié. Basé sur le modèle cyclique du marché de J. M. Hurst, il marque les creux de cycle confirmés (et éventuellement les sommets) de chaque niveau de cycle activé sous forme de losanges codés par couleur, projette le timing du prochain creux de cycle attendu, et met en évidence le « Nid de Creux » — des barres où plusieurs creux de cycle sont censés coïncider, le contexte classique de retournement à haute probabilité de Hurst.
CARACTÉRISTIQUES CLÉS
• 7 niveaux de cycle imbriqués (HC, 1C, 2x, 4x, 8x, 16x, 32x) — activez n'importe quelle combinaison.
• Losanges confirmés uniquement — les marqueurs les plus récents ne se repeignent PAS sur la barre en direct.
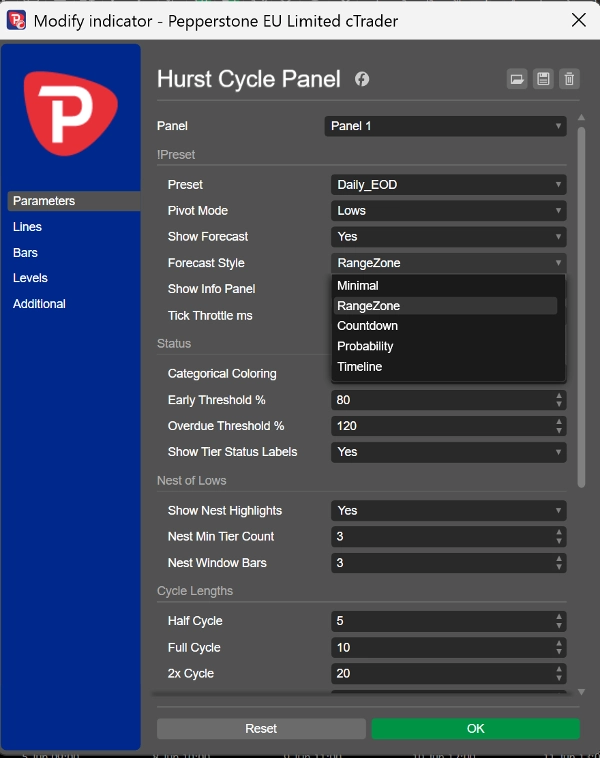
• Prévision du prochain creux en 5 styles d'affichage : Minimal, Zone de plage, Compte à rebours, Probabilité (1σ / 2σ), Chronologie.
• Mise en évidence du « Nid de Creux », ajustée automatiquement aux longueurs de cycle activées.
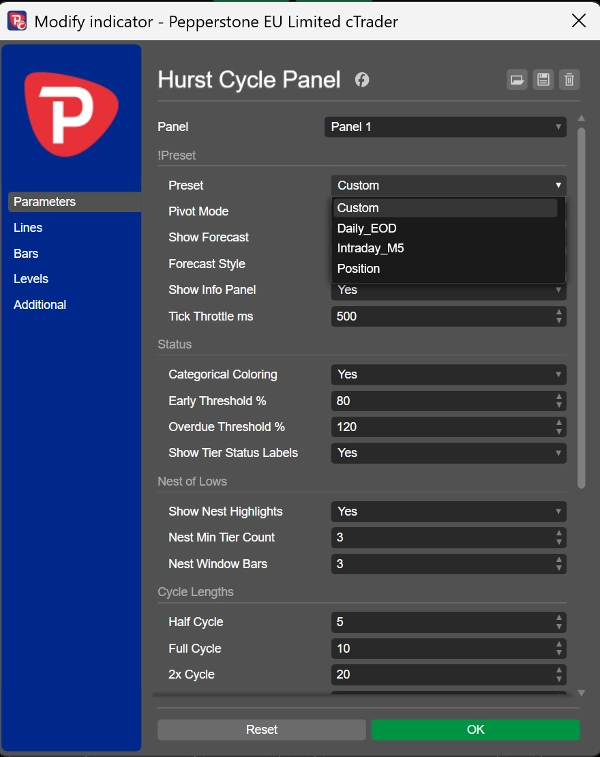
• Préréglages en un clic : EOD quotidien, Intraday M5, Position — ou longueurs de cycle entièrement personnalisées.
• Panneau d'information moderne sur le graphique : comptages de pivots par niveau, longueur moyenne de cycle mesurée (affichée uniquement lorsqu'elle est statistiquement significative), et vérification du ratio harmonique.
• Mode pivot : Creux, Sommets ou les deux.
• Échelle à ajustement automatique, rendu propre et sans scintillement.
COMMENT UTILISER
Ajoutez-le sous votre graphique de prix. Lisez les losanges les plus bas et la mise en évidence du « Nid » comme l'ossature du timing cyclique du marché, et utilisez la prévision pour anticiper la fenêtre temporelle du prochain retournement. Il se combine naturellement avec MTC Hurst FLD Akademica (niveaux de prix) et MTC Hurst Pulse Akademica (oscillateur de maturité cyclique).
FONCTIONNE SUR
Tout symbole et toute unité de temps.
AVERTISSEMENT
Ceci est un outil d'analyse technique et de visualisation basé sur la théorie cyclique du marché de J. M. Hurst. Il ne passe pas d'ordres et ne garantit pas de performance, d'exactitude ou de profit. L'analyse cyclique est probabiliste et les projections futures sont des estimations, pas des prédictions. Appliquez toujours votre propre gestion des risques et jugement. Le comportement passé du marché ne garantit pas les résultats futurs.
Résumé
Key features include seven nested cycle tiers (HC, 1C, 2x, 4x, 8x, 16x, 32x) with customizable combinations, one-click presets for common timeframes (Daily EOD, Intraday M5, Position), and a modern on-chart info panel showing pivot counts, average cycle length, and harmonic-ratio checks. Users can select pivot modes (Lows, Highs, or Both) and benefit from auto-fitting scale and flicker-free rendering.
The panel works on any symbol and timeframe and is intended as a visualization tool to aid cycle timing analysis. It complements other Hurst-based tools for price levels and cycle maturity oscillation.







![Logo de "[Hamster-Coder] Moving Average MTF"](https://cdn.ctrader.com/image/webp/b11b98b1-194d-4b8e-b00e-d611826ad159_31226)












