
TradingViewMACD
อินดิเคเตอร์
3 การซื้อ
เวอร์ชัน 1.0, Feb 2025
Windows, Mac
5.0
รีวิว: 1

คำอธิบาย
ตัวบ่งชี้ TradingViewMACD
ยกระดับกลยุทธ์การซื้อขายของคุณด้วยตัวบ่งชี้ TradingViewMACD ที่ปรับแต่งได้สูงของเรา ซึ่งออกแบบมาสำหรับแพลตฟอร์ม cAlgo เครื่องมือทรงพลังนี้ผสมผสานความยืดหยุ่นและความแม่นยำที่จำเป็นเพื่อเพิ่มประสิทธิภาพการวิเคราะห์ตลาดของคุณ
คุณสมบัติหลัก:
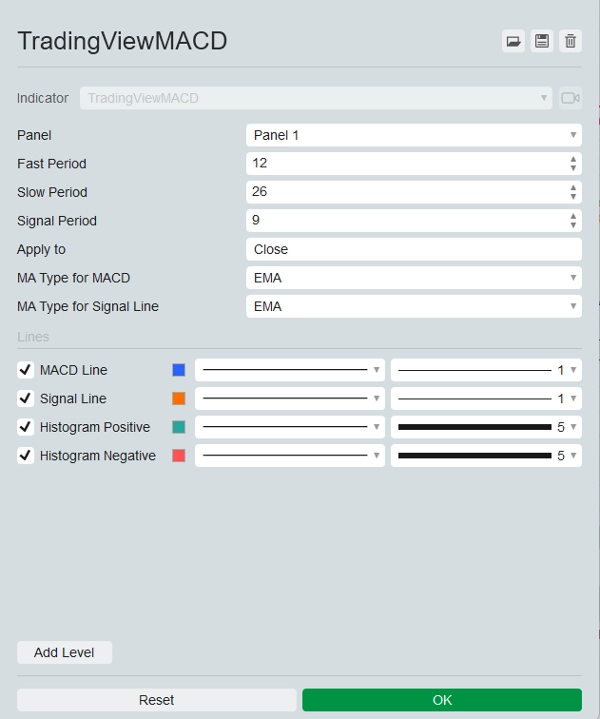
- พารามิเตอร์ที่ปรับแต่งได้:
-
- ช่วงเร็ว: ปรับช่วงค่าเฉลี่ยเคลื่อนที่เร็วให้เหมาะกับสไตล์การซื้อขายของคุณ
- ช่วงช้า: กำหนดช่วงค่าเฉลี่ยเคลื่อนที่ช้าเพื่อเพิ่มความแม่นยำของสัญญาณ
- ช่วงสัญญาณ: ตั้งค่าช่วงเส้นสัญญาณเพื่อปรับแต่งจุดเข้าและออกของคุณ
- ราคาที่ใช้: เลือกจากราคาเปิด สูง ต่ำ ปิด มัธยฐาน ทั่วไป หรือถ่วงน้ำหนักเพื่อใช้กับตัวบ่งชี้
- ประเภทค่าเฉลี่ยเคลื่อนที่หลายแบบ:
-
- เลือกได้ระหว่างค่าเฉลี่ยเคลื่อนที่แบบง่าย (SMA) และค่าเฉลี่ยเคลื่อนที่แบบเลขชี้กำลัง (EMA) สำหรับทั้งเส้น MACD และเส้นสัญญาณ เพื่อความยืดหยุ่นในการวิเคราะห์ของคุณ
- ผลลัพธ์ที่แสดง:
-
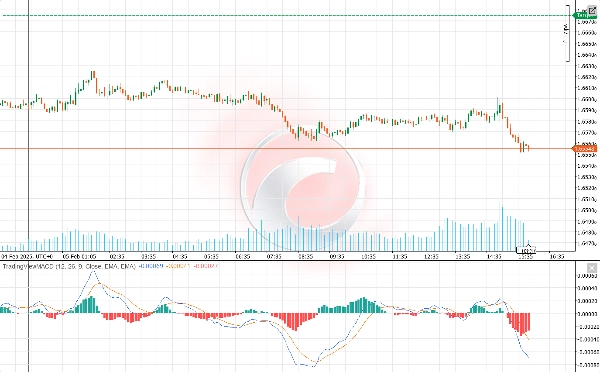
- เส้น MACD: แสดงด้วยสีฟ้าสดใสเพื่อความชัดเจน
- เส้นสัญญาณ: เน้นด้วยสีส้มสดใสเพื่อแยกความแตกต่างจากเส้น MACD ได้ง่าย
- ฮิสโตแกรม: แสดงความแตกต่างระหว่างค่าบวกและค่าลบด้วยสีเขียวและสีแดงตามลำดับ ให้ภาพที่ชัดเจนของโมเมนตัมตลาด
- ข้อมูลเชิงลึกของตลาดที่เพิ่มขึ้น:
-
- ตัวบ่งชี้คำนวณความแตกต่างระหว่างค่าเฉลี่ยเคลื่อนที่เร็วและช้าเพื่อสร้างเส้น MACD
- คำนวณเส้นสัญญาณเป็นค่าเฉลี่ยเคลื่อนที่ของเส้น MACD
- ฮิสโตแกรมแสดงภาพความแตกต่างระหว่างเส้น MACD และเส้นสัญญาณ ช่วยให้คุณระบุสัญญาณซื้อและขายที่เป็นไปได้
- ใช้งานง่าย:
-
- ติดตั้งและกำหนดค่าได้ง่าย ช่วยให้นักเทรดทุกระดับได้รับประโยชน์จากฟีเจอร์ขั้นสูง
- เอกสารครบถ้วนและการสนับสนุนลูกค้าเพื่อประสบการณ์ที่ราบรื่น
ปลดปล่อยศักยภาพเต็มที่ของกลยุทธ์การซื้อขายของคุณด้วยตัวบ่งชี้ TradingViewMACD ปรับปรุงการวิเคราะห์ตลาดของคุณ ตัดสินใจอย่างมีข้อมูล และนำหน้าคู่แข่งด้วยเครื่องมือการซื้อขายที่จำเป็นนี้
สรุป
สรุปโดย AI
The TradingViewMACD indicator for the cAlgo platform is a customizable technical analysis tool designed to enhance market analysis. It calculates the difference between fast and slow moving averages to generate the MACD line, computes a signal line as the moving average of the MACD line, and displays a histogram representing the difference between these lines to help identify potential buy and sell signals.
Key features include adjustable parameters such as fast period, slow period, signal period, and applied price (open, high, low, close, median, typical, or weighted). Users can select between Simple Moving Average (SMA) and Exponential Moving Average (EMA) types for both the MACD and signal lines, providing analytical flexibility.
Visual outputs consist of a blue MACD line, an orange signal line, and a histogram with green and red colors indicating positive and negative momentum, respectively. The indicator is designed for ease of installation and configuration, supported by comprehensive documentation and customer support to accommodate traders of all experience levels.
โปรไฟล์อินดิเคเตอร์
รีวิวจากลูกค้า
5.0
รีวิว: 1
5 | 100 % | |
4 | 0 % | |
3 | 0 % | |
2 | 0 % | |
1 | 0 % |
รีวิวจากลูกค้า
November 9, 2025
TradingView MACD brings the familiar feel straight to cTrader 🚀 - smooth, light, and 100% accurate to the original. Perfect for traders switching from TV who love clean momentum signals. Missing alerts, but flawless for classic trend and divergence play.
การสนทนา
คำถามที่พบบ่อย
Signal
MACD
ผลิตภัณฑ์ที่มีให้บริการผ่าน cTrader Store รวมถึงบอทการเทรด อินดิเคเตอร์ และปลั๊กอิน มีให้บริการโดยนักพัฒนาบุคคลที่สามและมีไว้เพื่อวัตถุประสงค์ในการเข้าถึงข้อมูลและทางเทคนิคเท่านั้น cTrader Store ไม่ใช่โบรกเกอร์และไม่ได้ให้คำแนะนำการลงทุน คำแนะนำส่วนบุคคล หรือการรับประกันผลการดำเนินงานในอนาคต


ราคา
ตั้งแต่ 22/11/2024
133
การขาย
2.58K
ติดตั้งฟรี