Description
MTC Akademika Harmonics
Structure harmonique du marché, lue à travers le prisme de la *Monadologie* de Leibniz — dans l'interprétation personnelle de David Murawski, der Mustermann.
Description courte
MTC Akademika Harmonics est une superposition de graphique fondée sur une conviction unique : le prix n'est pas du bruit, mais un plénum de réflexions. Fondé sur les principes de la *Monadologie* de Gottfried Wilhelm Leibniz — dans l'interprétation personnelle de plusieurs années de David Murawski, der Mustermann — il révèle où la structure harmonique du marché s'accorde à toutes les échelles, et condense cette lecture en un tableau de bord calme et professionnel. C'est un outil d'analyse et de visualisation discrétionnaire, pas un système automatisé ni un service de signaux.
L'idée
En 1714, Leibniz proposa que la réalité est composée d'unités simples et indivisibles — les *monades* — chacune reflétant l'univers entier de son propre point de vue, et que l'ordre que nous expérimentons découle d'une *harmonie préétablie* entre elles. Rien, soutenait-il, n'existe sans sa *raison suffisante*.
Cet indicateur applique cette vision du monde au graphique. Chaque structure, du plus léger mouvement au plus grand, est traitée comme un reflet d'un même tout — la partie contenue dans le tout, le tout répercuté dans la partie. Le sens ne provient d'aucun signal unique ; il émerge aux moments où des réflexions indépendantes s'harmonisent. Et aucun point de retournement n'est arbitraire — chacun porte sa raison dans la structure qui l'a produit.
Ce n'est pas un scanner de motifs générique. C'est la distillation par un auteur d'une idée vieille de trois cents ans en un instrument qui observe pour vous.
Ce que vous obtenez :
- **Une lecture cohérente à toutes les échelles** — le plus petit mouvement et le plus grand sur un seul graphique, pour voir la structure au lieu du désordre.
- **Des moments d'harmonie, marqués pour vous** — les rares situations où des réflexions indépendantes s'alignent sont mises en évidence, pour que le contexte le plus fort se démarque.
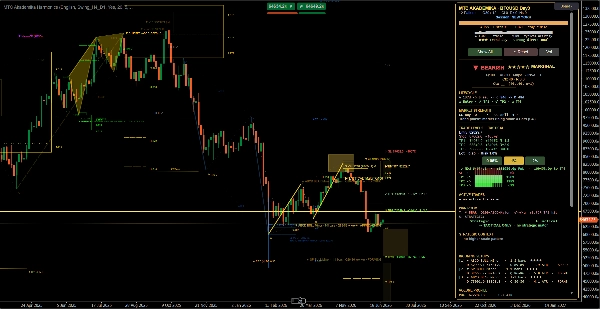
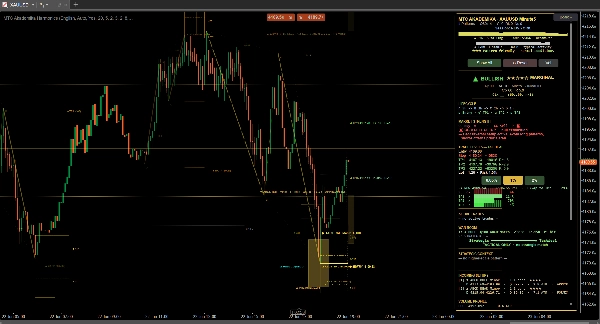
- **Configurations complètes et lisibles** — pour chaque structure : une zone claire, des objectifs projetés et un stop protecteur, avec le ratio récompense/risque affiché d'un coup d'œil.
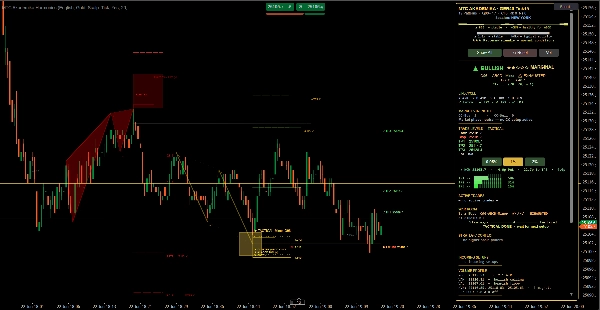
- **Un tableau de bord professionnel (War Room / UI Moderne)** — direction, conviction, contexte du marché et image multi-échelle, condensés en un seul panneau.
- **Cycle de vie en un coup d'œil** — chaque structure est étiquetée *active*, *épuisée* ou *invalide*, pour savoir toujours ce qui mérite votre attention et ce qu'il faut ignorer.
- **Une vue intégrée du risque** — taille de position basée sur la taille de votre compte et le risque par transaction, affichée dans la devise de votre compte.
- **Conscience multi-échelle et alertes** — lecture à une échelle supérieure, plus alertes optionnelles pour les nouvelles structures et les touches clés.
- **Un tutoriel guidé en sept langues** — il enseigne la philosophie et le panneau pendant que vous les utilisez.
À qui s'adresse-t-il
Aux traders discrétionnaires qui pensent en termes de structure plutôt qu'en indicateurs ; qui veulent une image calme et unifiée plutôt qu'un mur d'alertes ; et qui apprécient que les meilleurs instruments cachent leur mécanique et ne montrent que l'essentiel.
Sur la méthode
Comment l'harmonie est mesurée, comment les échelles se relient, comment la lecture se forme — ce sont le fruit de longues recherches privées et ne sont pas divulgués par conception. Vous acquérez le jugement, pas la recette.
Compatibilité
Fonctionne comme une superposition de graphique sur **n'importe quel symbole et n'importe quelle période** (y compris les graphiques tick). Interface en anglais, allemand, espagnol, italien, français, russe et portugais.
Risque
MTC Akademika Harmonics est un outil d'analyse et de visualisation discrétionnaire, pas un système de trading automatisé ni un service de signaux. Il met en lumière la structure et le contexte ; la décision de trader et la gestion du risque restent entièrement les vôtres. Le trading comporte un risque de perte. Les résultats passés ne garantissent pas les résultats futurs.