الوصف
كاشف التأرجح
نقاط التأرجح الهيكلية + تصحيح فيبوناتشي + مؤشر القوة النسبية
--------------------------------------------------
مؤشر مجاني
تحديد التأرجحات الهيكلية. رؤية الاتجاه. التداول بتوافق.
--------------------------------------------------
ما يفعله هذا المؤشر
يكشف كاشف التأرجح عن أعلى وأدنى نقاط التأرجح الهيكلية باستخدام اكتشاف القمم المحلية مع عمق قابل للتكوين وترشيح الانحراف التلقائي.
ثم يربط التأرجحات بخطوط الاتجاه، ويضع مستويات تصحيح فيبوناتشي القياسية، ويعرض قيمة مؤشر القوة النسبية الحالية بالقرب من السعر.
--------------------------------------------------
الميزات الرئيسية
- اكتشاف نقاط التأرجح (عمق قابل للتكوين)
- الانحراف التلقائي: ترشيح قائم على ATR يتكيف مع أي إطار زمني
- وضع انحراف ثابت بالنقاط (للسيطرة اليدوية)
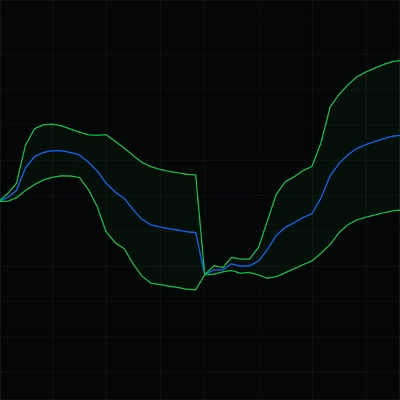
- خطوط اتجاه التأرجح (التأرجح الصاعد أزرق، التأرجح الهابط برتقالي)
- تصحيح فيبوناتشي (0، 23.6، 38.2، 50، 61.8، 78.6، 100 بالمئة)
- عرض قيمة مؤشر القوة النسبية (RSI الحالي بالقرب من السعر)
- ألوان قابلة للتخصيص
- محسّن للأداء (أقصى عدد من الأعمدة للرسم)
--------------------------------------------------
الانحراف التلقائي - ميزة رئيسية
هناك وضعان للانحراف متاحان:
- نقاط ثابتة: تعيين حد أدنى ثابت للمسافة بين التأرجحات
- قائم على ATR (تلقائي): انحراف ديناميكي بناءً على التقلب الحالي
لماذا الانحراف التلقائي مهم:
- من M1 إلى M5: انحراف ضيق (يلتقط التأرجحات الصغيرة)
- من H1 إلى H4: انحراف متوسط (يلتقط الهيكل)
- من D1 إلى MN1: انحراف واسع (يلتقط التأرجحات الكبرى)
يتكيف المؤشر تلقائيًا مع الإطار الزمني الذي تستخدمه. لا حاجة لتعديل يدوي عند تبديل المخططات.
هذا يجعل كاشف التأرجح قابلاً للاستخدام عبر جميع الأطر الزمنية — من مخططات الدقيقة الواحدة إلى الشهرية.
--------------------------------------------------
تصحيح فيبوناتشي - ميزة رئيسية
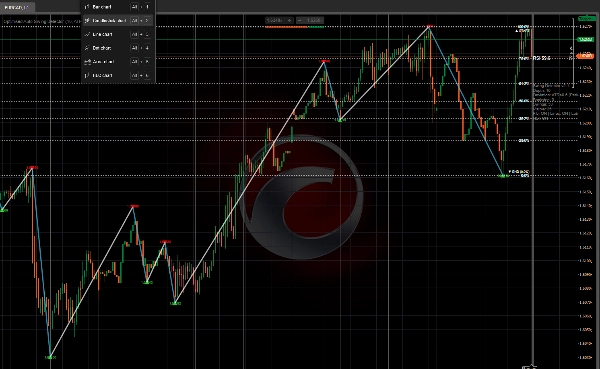
للتأرجح المكتمل الأخير، يرسم المؤشر:
- 0.0 بالمئة (بداية التأرجح)
- 23.6 بالمئة
- 38.2 بالمئة
- 50.0 بالمئة
- 61.8 بالمئة
- 78.6 بالمئة
- 100.0 بالمئة (نهاية التأرجح)
تبديل الخطوط والتسميات تشغيل/إيقاف. جميع المستويات ملونة لسهولة الإشارة البصرية السريعة.
--------------------------------------------------
عرض مؤشر القوة النسبية - ميزة رئيسية
يتم عرض قيمة مؤشر القوة النسبية الحالية بالقرب من السعر مع ترميز لوني:
- أحمر: مؤشر القوة النسبية فوق 70 (تشبع شراء)
- أخضر: مؤشر القوة النسبية تحت 30 (تشبع بيع)
- أبيض: مؤشر القوة النسبية بين 30 و 70 (محايد)
يوفر هذا سياقًا فوريًا للزخم دون الحاجة لفتح نافذة مؤشر القوة النسبية منفصلة.
--------------------------------------------------
العناصر المرئية
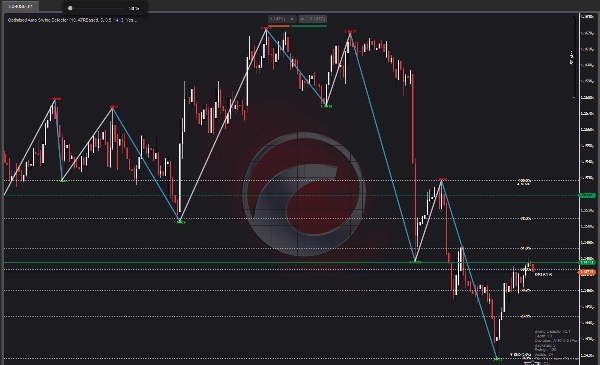
- سهام حمراء للأسفل = قمم التأرجح
- سهام خضراء للأعلى = قيعان التأرجح
- خطوط زرقاء = تأرجح صاعد (من القاع إلى القمة)
- خطوط برتقالية = تأرجح هابط (من القمة إلى القاع)
- خطوط أفقية ذهبية = مستويات فيبوناتشي
- تسميات بيضاء = نسب فيبوناتشي
- قيمة مؤشر القوة النسبية = مؤشر القوة النسبية الحالي بالقرب من السعر
- لوحة المعلومات = العمق، الانحراف، التراجع، عدد التأرجحات
--------------------------------------------------
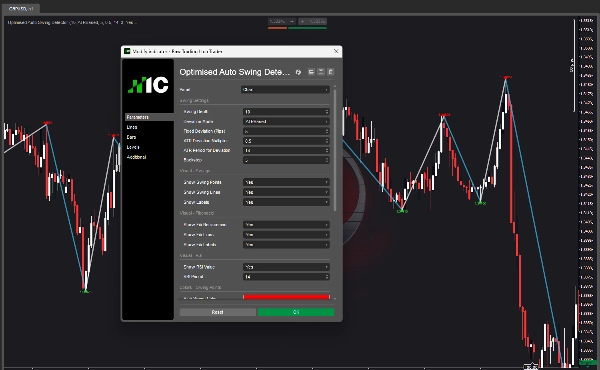
نظرة عامة على المعلمات
إعدادات التأرجح:
- عمق التأرجح: عدد الأعمدة لفحص القمم المحلية
- وضع الانحراف: نقاط ثابتة أو قائم على ATR (تلقائي)
- الانحراف الثابت: الحد الأدنى للمسافة بالنقاط بين التأرجحات
- مضاعف انحراف ATR: مضاعف للانحراف القائم على ATR
- فترة ATR: فترة حساب ATR
- التراجع: الحد الأدنى للأعمدة بين التأرجحات
المرئي - التأرجحات:
- عرض نقاط التأرجح: تبديل الأسهم
- عرض خطوط التأرجح: تبديل خطوط الاتجاه
- عرض التسميات: تبديل تسميات السعر
المرئي - فيبوناتشي:
- عرض تصحيح فيبوناتشي: تبديل التراكب
- عرض خطوط فيبوناتشي: تبديل الخطوط الأفقية
- عرض تسميات فيبوناتشي: تبديل تسميات النسبة المئوية
المرئي - مؤشر القوة النسبية:
- عرض قيمة مؤشر القوة النسبية: تبديل التراكب
- فترة مؤشر القوة النسبية: فترة حساب المؤشر
الألوان:
- لون قمة التأرجح
- لون قاع التأرجح
- لون خط التأرجح الصاعد
- لون خط التأرجح الهابط
- لون خط فيبوناتشي
- لون نص فيبوناتشي
- لون تسمية مؤشر القوة النسبية
الأداء:
- الحد الأقصى للأعمدة للرسم: يحد من الرسم لأداء أسرع
--------------------------------------------------
حالات الاستخدام
- تحديد نقاط التأرجح الهيكلية على أي إطار زمني
- رسم خطوط الاتجاه بين التأرجحات
- استخدام مستويات فيبوناتشي للدخول، الخروج، وأهداف الربح
- تأكيد الصفقات بتوافق مؤشر القوة النسبية
- فهم هيكل السوق بنظرة سريعة
- تبديل الأطر الزمنية دون تعديل المعلمات (الانحراف التلقائي)
--------------------------------------------------
قابلية استخدام الإطار الزمني
مع تمكين الانحراف التلقائي، يعمل المؤشر عبر:
- M1، M5، M15 (سكالبينج)
- M30، H1، H4 (تداول يومي)
- D1 (تداول تأرجحي)
- W1، MN1 (تداول موقفي)
مؤشر واحد. جميع الأطر الزمنية.
--------------------------------------------------
الترقية إلى مناطق الحرارة الهيكلية
يعرض هذا المؤشر المجاني التأرجحات والهيكل.
تأخذ مناطق الحرارة الهيكلية الأمر إلى أبعد من ذلك — حيث ترسم كثافة المشاركة، القبول مقابل الرفض، وتفاعل السوق عبر مناطق متعددة.
ابحث عن مناطق الحرارة الهيكلية في متجر cTrader.
--------------------------------------------------
الترقية إلى Invictus EA
يستخدم Invictus EA نفس التكنولوجيا الهيكلية لتنفيذ الصفقات الآلية.
ابحث عن Invictus في متجر cTrader.
--------------------------------------------------
ملاحظات فنية
- مؤشر تراكبي
- يعمل على أي إطار زمني ورمز
- لا يعيد الرسم (التأرجحات تاريخية)
- محسّن للأداء
--------------------------------------------------
الدعم
تحديثات مدى الحياة متضمنة.
لمزيد من المعلومات - انقر على ملف المطور أدناه.
الملخص
تقييمات العملاء
5 | 100 % | |
4 | 0 % | |
3 | 0 % | |
2 | 0 % | |
1 | 0 % |