

คำอธิบาย
โซนความร้อนเชิงโครงสร้าง
แผนที่ความเข้มข้นของการมีส่วนร่วม
--------------------------------------------------
ดูว่าราคาต่อสู้ที่ไหน ดูว่าราคาเพิกเฉยที่ไหน
เครื่องมือสนับสนุน/ต้านทานส่วนใหญ่จะวาดเส้นที่ราคาผ่านมาแล้ว
โซนความร้อนเชิงโครงสร้างตอบคำถาม: ตลาดสนใจระดับนี้จริงหรือไม่?
--------------------------------------------------
การให้คะแนนความเข้มข้นของความร้อน (0 ถึง 100)
ตัวชี้วัดวิเคราะห์การรวมตัวของสวิงและกำหนดคะแนนความร้อน:
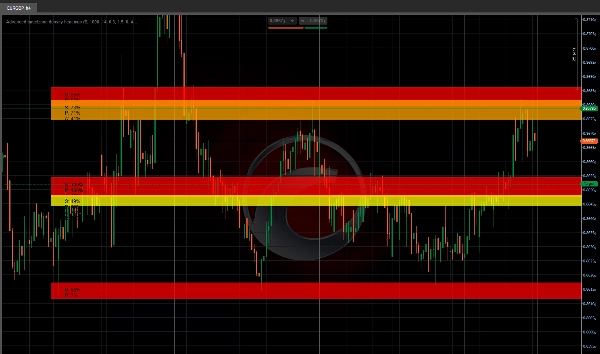
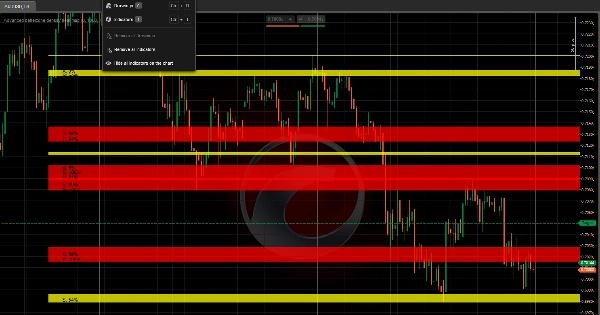
- โซนสีแดง (ความร้อน 80 ถึง 100) = การมีส่วนร่วมเชิงโครงสร้างที่แข็งแกร่งที่สุด
- โซนสีส้ม (ความร้อน 60 ถึง 80) = โซนเชิงโครงสร้างที่ใช้งานอยู่
- โซนสีเหลือง (ความร้อน 40 ถึง 60) = ความสนใจปานกลาง
- โซนสีน้ำเงิน (ความร้อนต่ำกว่า 40) = โครงสร้างอ่อนแอ
ความร้อนสูง = สวิงรวมตัวมากขึ้น = ความสนใจของตลาดมากขึ้น
--------------------------------------------------
การติดตามการยอมรับและการปฏิเสธ
สำหรับแต่ละโซนความร้อนเชิงโครงสร้าง ตัวชี้วัดจะติดตามพฤติกรรมราคาดังนี้:
- การยอมรับ = ราคาปิดภายในโซน (พฤติกรรมสนับสนุน)
- การปฏิเสธ = ราคาทิ้งไส้เทียนยาวที่โซน (พฤติกรรมต้านทาน)
สิ่งนี้บอกคุณว่าโซนนั้นมีแนวโน้มที่จะยึดมั่นหรือกลับตัว
--------------------------------------------------
การวิเคราะห์การมีส่วนร่วมของตลาด
ระบบวัด:
- การสัมผัสแท่งเทียน (ความถี่ที่ราคามาเยือนแต่ละโซน)
- การปิดภายใน (อัตราการยอมรับ)
- การปฏิเสธด้วยไส้เทียน (อัตราการปฏิเสธ)
- ช่วงเวลาย้อนหลังที่ปรับได้
การมีส่วนร่วมน้อย = โซนอ่อน การมีส่วนร่วมสูง = โซนความร้อนเชิงโครงสร้าง
--------------------------------------------------
การทำแผนที่ความเข้มข้นด้วยภาพ
- โซนที่ระบายสีตามคะแนนความร้อน (สีแดง = ร้อนที่สุด)
- ขยายฮาโลสำหรับการแสดงภาพการปฏิเสธ
- ป้ายข้อมูลแสดง: ความร้อน / การมีส่วนร่วม / การยอมรับ / คะแนนการปฏิเสธ
- การทำความสะอาดอัตโนมัติ (โซนจะวาดใหม่โดยอัตโนมัติ)
- ลูกศรสวิงสูง/ต่ำที่เลือกได้
--------------------------------------------------
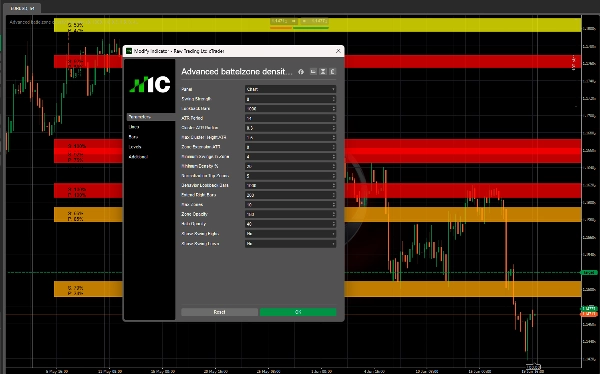
พารามิเตอร์หลัก
- ความแข็งแกร่งของสวิง: ความไวของจุดหมุน (สูง = สวิงน้อยลง)
- แท่งย้อนกลับ: ระยะเวลาย้อนหลังสำหรับตรวจจับสวิง
- ช่วง ATR: สำหรับการคำนวณรัศมีปรับตัว
- รัศมีคลัสเตอร์ ATR: ระยะห่างที่สวิงต้องอยู่ใกล้กันเพื่อรวมตัว
- ความสูงสูงสุดของคลัสเตอร์ ATR: ปฏิเสธโซนที่กว้างกว่านี้
- การขยายโซน ATR: ขนาดฮาโลสำหรับการตรวจจับการปฏิเสธ
- จำนวนสวิงขั้นต่ำในโซน: ขนาดคลัสเตอร์ขั้นต่ำ
- คะแนนความร้อนขั้นต่ำ: แสดงเฉพาะโซนที่สูงกว่านี้
- แท่งย้อนกลับพฤติกรรม: ช่วงเวลาสำหรับติดตามการมีส่วนร่วม
- จำนวนโซนสูงสุด: จำนวนโซนที่แสดงสูงสุด
- ความทึบของโซน/ฮาโล: ความโปร่งใสทางสายตา
--------------------------------------------------
กรณีการใช้งาน
- ค้นหาโซนความร้อนเชิงโครงสร้างแท้จริง (ความร้อนสูง + การมีส่วนร่วมสูง)
- แยกแยะโซนการยอมรับจากโซนการปฏิเสธ
- หลีกเลี่ยงพื้นที่ที่มีความร้อนต่ำและการมีส่วนร่วมน้อย
- ระบุคลัสเตอร์เชิงโครงสร้างสำหรับการวางตำแหน่งเข้าและออก
- การรวมกับตัวชี้วัดแนวโน้มหรือการไหลของคำสั่ง
--------------------------------------------------
บันทึกทางเทคนิค
- ตัวชี้วัดซ้อนทับ (วาดบนกราฟราคา)
- ใช้งานได้กับทุกช่วงเวลาและสัญลักษณ์
- ปรับตัวอัตโนมัติตามความผันผวนผ่าน ATR
- ไม่มีการวาดซ้ำ (สวิงเป็นข้อมูลในอดีต)
--------------------------------------------------
จากผู้สร้าง INVICTUS EA
โซนความร้อนเชิงโครงสร้างใช้เทคโนโลยีการมีส่วนร่วมเชิงโครงสร้างเดียวกับที่พบในระบบการซื้อขายอัตโนมัติ Invictus
--------------------------------------------------
การเปิดเผยความเสี่ยง
ตัวชี้วัดนี้เป็นเครื่องมือวิเคราะห์ ไม่ได้สร้างสัญญาณการซื้อขายอัตโนมัติ การตัดสินใจซื้อขายทั้งหมดเป็นความรับผิดชอบของผู้ใช้
--------------------------------------------------
การสนับสนุน
รวมการอัปเดตตลอดชีพ
สำหรับข้อมูลเพิ่มเติม - คลิกโปรไฟล์ผู้พัฒนาด้านล่าง
สรุป
Key features include color-coded heat zones, halo extensions for rejection visualization, and data labels displaying heat, participation, acceptance, and rejection scores. The system measures candle touches, closes inside zones, and wick rejections over a configurable lookback period to quantify market engagement. Adjustable parameters allow customization of swing sensitivity, cluster radius, zone size, and visual opacity.
This tool supports any timeframe and symbol, adapts to volatility using ATR, and does not repaint historical swings. It is intended for identifying genuine structural heat zones, differentiating acceptance from rejection areas, and aiding entry and exit placement in conjunction with other trend or order flow indicators. The indicator is analytical and does not generate automated trading signals.
รีวิวจากลูกค้า
5 | 100 % | |
4 | 0 % | |
3 | 0 % | |
2 | 0 % | |
1 | 0 % |





























