present
Sign up and get $50 off your first purchase
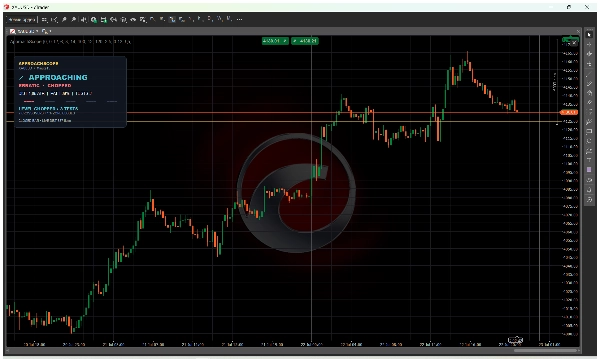
Trading product for ApproachScope-v1.0.0 Indicator Key Levels ATR, image 1
ApproachScope-v1.0.0
Indicator
Version 1.0, Jul 2026
Windows, Mac
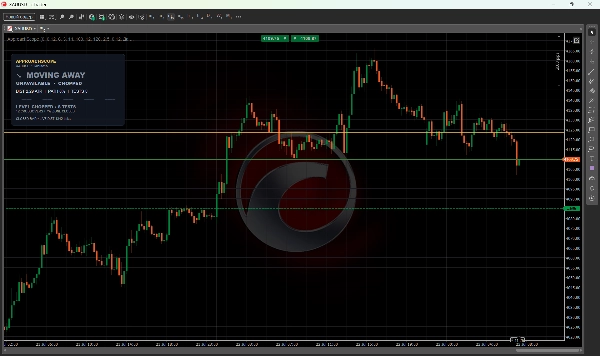
Trading product for ApproachScope-v1.0.0 Indicator Key Levels ATR, image 2
Trading product for ApproachScope-v1.0.0 Indicator Key Levels ATR, image 3
Trading product for ApproachScope-v1.0.0 Indicator Key Levels ATR, image 4
Trading product for ApproachScope-v1.0.0 Indicator Key Levels ATR, image 5
Since 17/06/2026
137
Free installs

Description

READ THE APPROACH - BEFORE PRICE REACHES YOUR LEVEL

ApproachScope turns one trader-selected level into a clear, factual dashboard. It shows how price is arriving, how much the level has already been tested and whether the current data is reliable—especially useful for XAUUSD execution on M1–M15.

WHAT YOU SEE IN ONE SECOND

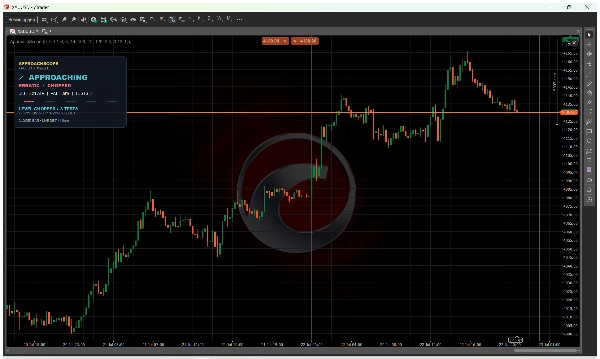
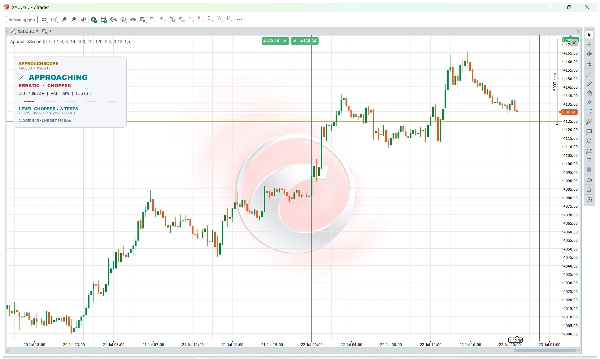
  • Market state: WAITING, APPROACHING, AT LEVEL or MOVING AWAY
  • Approach character: ORDERLY, COMPRESSED, IMPULSIVE, ERRATIC or MIXED
  • Level wear: FRESH, TESTED, WORN or CHOPPED
  • ATR-normalised distance, path efficiency, test count and live spread context

HOW IT WORKS

Drag the amber line to your own support, resistance, session, range or higher-timeframe level. ApproachScope analyses completed bars around that exact price. Every classification includes a short factual reason—there is no unexplained probability score.

HOW TO READ THE PANEL

  • APPROACHING - price is progressing toward your level
  • AT LEVEL - the completed bar interacted with the level zone
  • MOVING AWAY - price is leaving the level
  • MARKET CLOSED / INSUFFICIENT DATA - analysis is unavailable or less reliable

BEST FOR

Discretionary intraday traders who choose their own levels and want cleaner context before deciding. All chart timeframes and symbols with valid OHLC and scale data are supported. Broker-specific XAUUSD prefixes and suffixes are handled without exact-name dependency.

KEY SETTINGS

Zone width in ATR, minimum zone in ticks, touch separation, ATR and baseline periods, approach and wear lookbacks, near distance, spread warning, live distance, theme and panel scale.

LOCAL, PRIVATE AND SAFE

ApproachScope runs locally with cTrader access rights set to None. No account history, telemetry, network connection or external server. It cannot place, modify or close trades.

IMPORTANT LIMITATIONS

ApproachScope does not find levels, issue buy or sell signals, predict a bounce or breakout, calculate win probability, TP or SL, or fetch news. ORDERLY describes the recent path; it is not a recommendation. FRESH does not guarantee a bounce, and CHOPPED does not guarantee a breakout. Results depend on broker data, spread, history and symbol specifications. Trading involves risk; always use independent confirmation and risk management.

Summary

AI summary
ApproachScope is a trading indicator designed to analyze how price approaches a trader-selected level using closed-bar path, volatility, and level wear. It provides a concise dashboard showing the market state—such as WAITING, APPROACHING, AT LEVEL, or MOVING AWAY—and characterizes the approach as ORDERLY, COMPRESSED, IMPULSIVE, ERRATIC, or MIXED. The indicator also assesses level wear (FRESH, TESTED, WORN, or CHOPPED) and displays ATR-normalized distance, path efficiency, test count, and live spread context.

Users set a level by dragging an amber line to their chosen support, resistance, session, range, or higher-timeframe price. ApproachScope analyzes completed bars around this level, offering factual classifications with explanations rather than probabilistic scores. It supports all chart timeframes and symbols with valid OHLC and scale data, with special handling for XAUUSD on M1–M15 timeframes.

The indicator runs locally without network access or trade execution capabilities, ensuring privacy and safety. Key configurable settings include zone width, minimum zone size, lookback periods, spread warnings, and panel display options. ApproachScope is intended for discretionary intraday traders seeking clearer context on price behavior near key levels.
Indicator profile

Customer reviews

0.0
Reviews: 0
Customer reviews
No reviews for this product yet. Already tried it? Be the first to tell others!

Discussion

FAQ

Key Levels
ATR
Support & Resistance
Products available through cTrader Store, including trading bots, indicators and plugins, are provided by third-party developers and made available for informational and technical access purposes only. cTrader Store is not a broker and does not provide investment advice, personal recommendations or any guarantee of future performance.

More from this author

Indicator
ATR
Key Levels
+5
Gold chart overlay for XAUUSD: sessions, ADR zones, round levels, spread panel and sweep marks.
Indicator
Key Levels
Liquidity Grab
+2
A practical XAUUSD workspace for mapped levels, session context, liquidity events, alerts and risk planning.
Indicator
Volume
Account-wide discipline HUD that explains tilt patterns and compares Clean versus Flagged P&L in real time.
Indicator
ATR
Key Levels
+1
See how price reaches your level with clear states, ATR distance, touch count, level wear and spread context.

You may also like

Indicator
ATR
RSI
+15
Identifies high-probability breakout and retest zones using smart pivot structure and volatility filtering.
Indicator
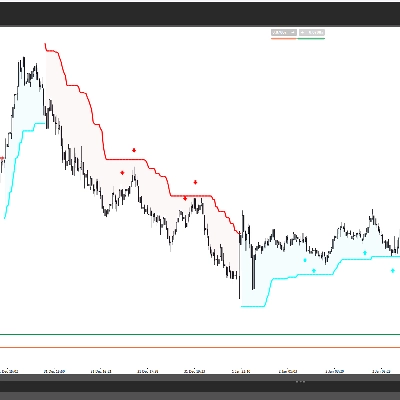
Supertrend-based channel for entries, trailing stops, and dynamic support/resistance zones.
Indicator
ATR
EMA
+4
Range-filter BUY/SELL signals scored by four confluence layers, with a stop, five targets and a trend panel
Indicator
ATR
RSI
+5
🚀 HAI QUANTUM v4.0 | The Ultimate Quantum Terminal for cTrader (Smart Money & Algorithmic Trading)
Indicator
Forex
Enhance your trading strategy with automated detection and alerts for key chart patterns.
Indicator
Signal
Dark Poll Signal Indicator.liquidity leakage,precedes the great movement, accumulation, distribution
Indicator
MACD
Forex
+6
Auto Signal BUY SELL is a professional decision-making tool designed to help you follow the trend and capture high-proba
Indicator
ADX
Moving Average
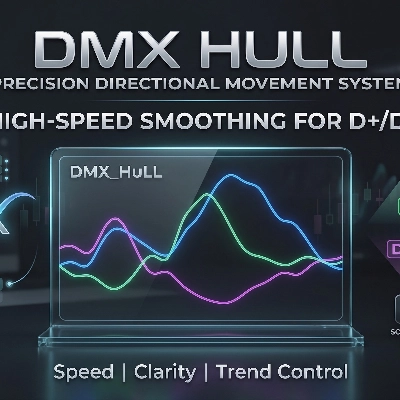
DMX Hull transforms complex directional movement data into a fluid visual tool.
Indicator
RSI
Forex
+12
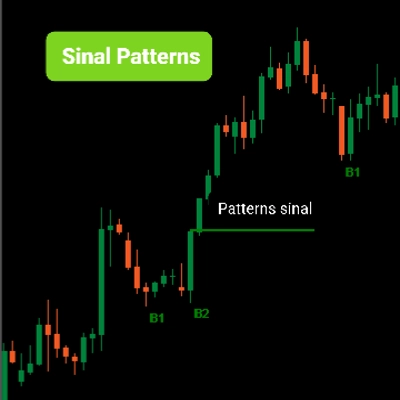
Indicator pattern signal moment
Indicator
Forex
BTCUSD
+5
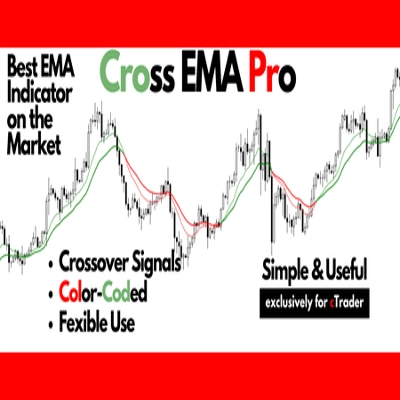
Cross EMA Pro – Trend Reversal Indicator
Indicator
Volume
Custom range volume profile between two draggable anchors. Auto source timeframe, Total/Up-Down/Delta, POC, Value Area.
Indicator
CHOCH
Inducement
+5
TradeLens - Frame the Trade. Refine the Entry. Two Timeframes. One Decision.
Indicator
MultiTF Pivot and SR Indicator
Indicator
RSI
EURUSD
+2
It identifies areas of market imbalance (Fair Value Gaps or FVGs) and projects them on the chart in a smart way
Indicator
Volume
Channel
+3
A higher-timeframe log-regression channel with a volume profile, Point of Control and session levels.
Indicator
VWAP
Volume distribution analysis with Market Profile TPO integration.
Indicator
AI-assisted
Predictive Monte Carlo Engine Forecast future price paths using institutional-grade statistical models and probability
Indicator
AI
ATR
+27
The "Market Temperature" Moving Average -Turn Your MA Into a Live Market Temperature Line

Price

Since 17/06/2026
137
Free installs