Description
🎯 SEE HOW PRICE REACHES YOUR LEVEL
If you already mark your own support and resistance levels, you know the level itself is only half the story. The way price reaches it matters too.
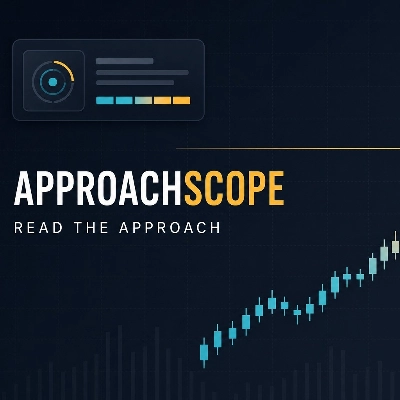
ApproachScope reads completed candles around the level you choose and turns that movement into a compact panel. You get useful context for your own trading decision, not another unexplained buy or sell arrow.
📊 WHAT THE PANEL SHOWS
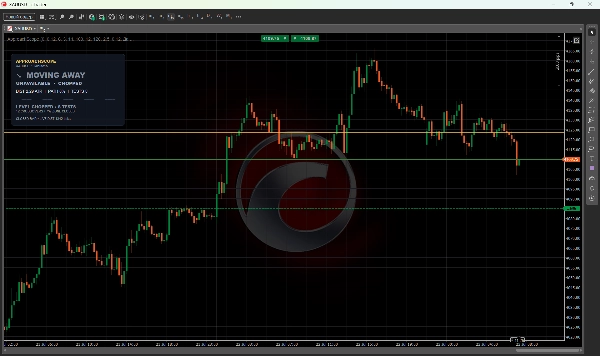
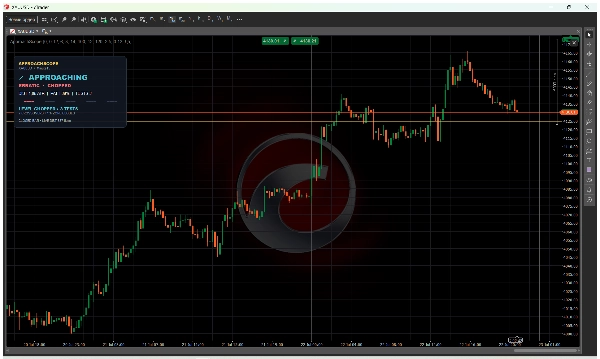
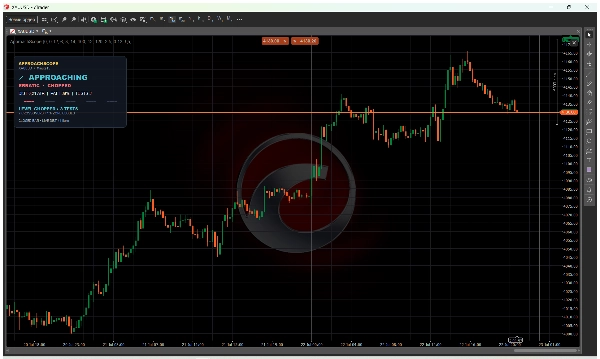
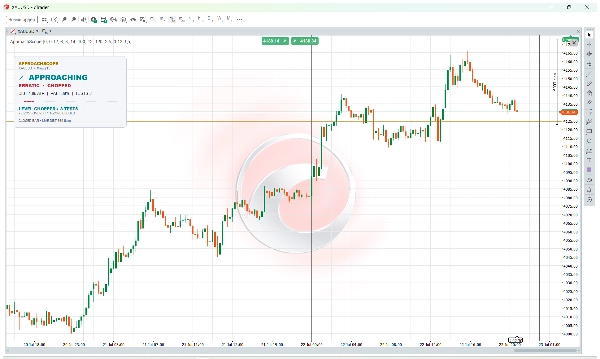
• Market state: WAITING, APPROACHING, AT LEVEL or MOVING AWAY
• Approach style: ORDERLY, COMPRESSED, IMPULSIVE, ERRATIC or MIXED
• Level condition: FRESH, TESTED, WORN or CHOPPED
• Distance in ATR, path efficiency, touch count and current spread
🛠️ HOW TO USE IT
1. Add ApproachScope to a chart.
2. Drag the amber line to your support, resistance, session, range or higher timeframe level.
3. Read the panel as price moves closer to or away from that level.
The calculations use completed bars, so every state is easy to check against the chart. Each classification also includes a short explanation. There is no hidden probability score.
👍 WHO IT IS FOR
ApproachScope is designed for discretionary intraday traders who already choose their own levels and want a cleaner view of the approach. It works with symbols and timeframes that provide valid price and scale data. Broker prefixes and suffixes for XAUUSD are supported.
⚙️ SETTINGS
You can adjust the ATR zone width, minimum zone size, touch separation, ATR and baseline periods, approach and wear lookbacks, spread warning, theme and panel scale.
🔒 PRIVACY AND CONTROL
The indicator runs locally in cTrader without elevated access rights. It does not connect to external servers, collect account history or send telemetry. It cannot open, modify or close trades.
⚠️ PLEASE NOTE
ApproachScope does not choose levels, generate buy or sell signals, predict a bounce or breakout, calculate win probability, set TP or SL, or load news.
ORDERLY does not mean buy or sell. FRESH does not guarantee a bounce. CHOPPED does not guarantee a breakout. Results depend on broker data, spread, history and symbol settings. Always use your own confirmation and risk management.
Summary
Key features of the panel include:
- Market state classification: WAITING, APPROACHING, AT LEVEL, or MOVING AWAY.
- Approach style identification: ORDERLY, COMPRESSED, IMPULSIVE, ERRATIC, or MIXED.
- Level condition status: FRESH, TESTED, WORN, or CHOPPED.
- Quantitative metrics such as distance in ATR (Average True Range), path efficiency, touch count, and current spread.
Users add ApproachScope to their chart and position an amber line on their chosen level (support, resistance, session, range, or higher timeframe). The indicator uses completed bars for calculations, ensuring transparency and easy verification against the chart. Each classification includes explanatory notes without relying on hidden probability scores.
Settings allow customization of ATR zone width, minimum zone size, touch separation, lookback periods, spread warnings, theme, and panel scale. The indicator operates locally within cTrader, does not connect to external servers, and does not execute trades. It supports symbols and timeframes with valid price and scale data, including broker prefixes and suffixes for XAUUSD.
Discussion
Customer reviews
5 | 100 % | |
4 | 0 % | |
3 | 0 % | |
2 | 0 % | |
1 | 0 % |