
DynamicVolumeSupplyDemand
อินดิเคเตอร์
1.29K ดาวน์โหลด
เวอร์ชัน 1.0, Apr 2025
Windows, Mac
4.2
รีวิว: 5
คำอธิบาย
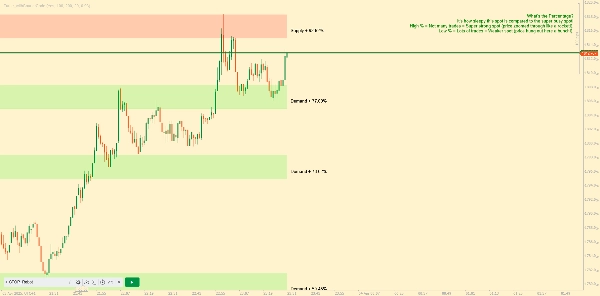
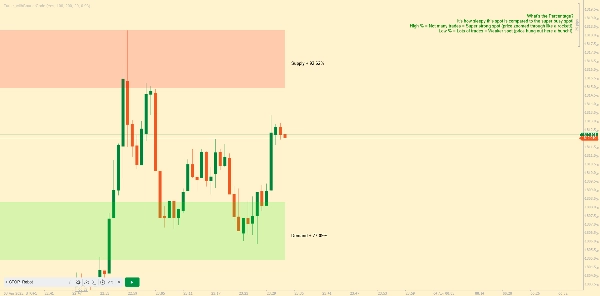
แนะนำโซนอุปทานและอุปสงค์แบบไดนามิกโดย AlgoAlpha ที่สร้างขึ้นใหม่โดยฉันสำหรับแพลตฟอร์ม Ctrader ตัวบ่งชี้นี้ถูกออกแบบมาเพื่อระบุและแสดงโซนอุปทานและอุปสงค์แบบไดนามิกบนแผนภูมิของคุณโดยอัตโนมัติ ช่วยให้นักเทรดสามารถระบุพื้นที่ที่อาจเกิดการกลับตัวและประเมินความรู้สึกของตลาดได้อย่างชัดเจนยิ่งขึ้น มันปรับตัวเข้ากับสภาพตลาดโดยใช้กลไกการย้อนดูแบบไดนามิก ทำให้ตอบสนองต่อการเคลื่อนไหวของราคาล่าสุดได้ดีขึ้น 📈💡
คุณสมบัติหลัก
- 📊 การย้อนดูแบบไดนามิก: ปรับระยะเวลาการย้อนดูโดยอัตโนมัติตามจุดหมุนล่าสุด เพื่อให้แน่ใจว่าข้อมูลที่เกี่ยวข้องที่สุดถูกวิเคราะห์
- 🎯 การตรวจจับจุดหมุน: ใช้ระยะเวลาที่ผู้ใช้กำหนดเพื่อค้นหาจุดสูงและต่ำที่สำคัญของจุดหมุน ทำเครื่องหมายจุดกลับตัวที่เป็นไปได้อย่างแม่นยำ
- 🛠 พารามิเตอร์ที่ปรับแต่งได้: มีตัวเลือกการปรับแต่งอย่างกว้างขวาง รวมถึงระยะเวลาการย้อนดู ความไวในการตรวจจับจุดหมุน ความละเอียด และความทนทานของโซน
- 🗺 การแสดงผลภาพ: แสดงโซนอุปทานและอุปสงค์เป็นกล่องบนแผนภูมิ พร้อมการเน้นพื้นหลังเพื่อแยกความแตกต่างระหว่างโซนขาขึ้นและขาลง
- 🖍 โซนที่มีรหัสสี: โซนถูกระบุด้วยสีเพื่อให้ง่ายต่อการจำแนก: สีเขียวสำหรับขาขึ้น สีแดงสำหรับขาลง และสีเทาสำหรับระดับที่เป็นกลาง
สรุป
สรุปโดย AI
DynamicVolumeSupplyDemand is an indicator for the cTrader platform that automatically identifies and visualizes dynamic supply and demand zones on trading charts. It helps traders locate potential reversal areas and evaluate market sentiment by adapting to recent price movements through a dynamic look-back mechanism. Key features include:
- Dynamic Look-Back: Automatically adjusts the look-back period based on the latest pivot points to analyze the most relevant data.
- Pivot Point Detection: Uses a user-defined period to detect significant pivot highs and lows, marking potential reversal points.
- Customizable Parameters: Allows adjustment of look-back period, pivot detection sensitivity, resolution, and zone tolerance.
- Visual Display: Presents supply and demand zones as boxes on the chart with background highlighting to distinguish bullish and bearish zones.
- Color-Coded Zones: Zones are color-coded for clarity—green for bullish, red for bearish, and gray for neutral levels.
This indicator supports enhanced clarity in market analysis by dynamically adapting to changing market conditions and providing clear visual cues for supply and demand levels.
โปรไฟล์อินดิเคเตอร์
รีวิวจากลูกค้า
4.2
รีวิว: 5
5 | 40 % | |
4 | 40 % | |
3 | 20 % | |
2 | 0 % | |
1 | 0 % |
รีวิวจากลูกค้า
October 12, 2025
Could you please make a new indicator so too remove the explanation and how the indicator works written on the chart? Very nice indicator otherwise!
August 12, 2025
Pros: Identifies dynamic supply and demand zones based on volume. Flexible settings, strong visual clarity. Cons: No alerts or tooltips. Lacks history of previous zones and user template saving.
May 15, 2025
This indicator finds the supply and demand areas very well but it has a problem. But the explanation and how the indicator works written on the chart is very annoying. I hope the designer of this software will solve this problem. Thank you
การสนทนา
คำถามที่พบบ่อย
ผลิตภัณฑ์ที่มีให้บริการผ่าน cTrader Store รวมถึงบอทการเทรด อินดิเคเตอร์ และปลั๊กอิน มีให้บริการโดยนักพัฒนาบุคคลที่สามและมีไว้เพื่อวัตถุประสงค์ในการเข้าถึงข้อมูลและทางเทคนิคเท่านั้น cTrader Store ไม่ใช่โบรกเกอร์และไม่ได้ให้คำแนะนำการลงทุน คำแนะนำส่วนบุคคล หรือการรับประกันผลการดำเนินงานในอนาคต


ราคา
ตั้งแต่ 09/01/2025
11.78K
ติดตั้งฟรี