
คำอธิบาย
ตัวชี้วัด Pinescriptlabs Store: 🤖Pinescriptlabs Store cBots : (cBot)
PRICE ACTION (ใหม่)
Gold & BTC BreakoutSession Pivots(ใหม่)
Trailing Smart Algorithm(ใหม่)
SmartTrend Support &
Resistance
Lines
Dynamic
Market Structure
Analysis
of
Turning Points
Fibonacci
Linear
Regression
Multi-timeframe
Multi-Level
Candle Bias
Tracker
Auto
Support and
Resistance
Trend
Lines
All
Support and
Resistance
Levels
Zig Zag Support & Resistance with Swings
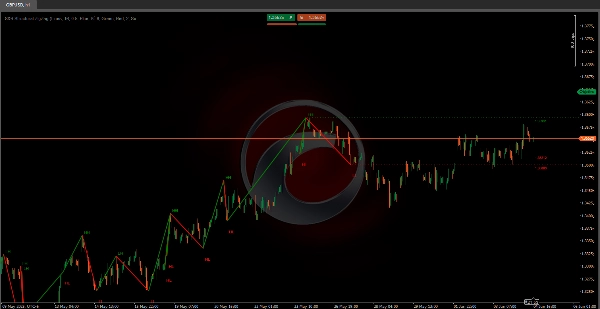
1. ตัวชี้วัดนี้ทำอะไร? ❓
🔍 ตรวจจับการแกว่งของราคา (สูงสุด & ต่ำสุด)
- สแกนแท่งเทียนล่าสุด ("ความลึกของการวิเคราะห์") เพื่อค้นหา ราคาสูงสุด/ต่ำสุด ในช่วงนั้น.
- ยืนยันการแกว่งด้วย เกณฑ์ % (เช่น การเปลี่ยนแปลง 1%+ เทียบกับการแกว่งครั้งก่อน) → ทำเครื่องหมายใหม่ ✅ จุดสูง/ต่ำของการแกว่ง.
- ลดเสียงรบกวน ⚡: ยืนยันการแกว่งเฉพาะเมื่อ ครึ่งหนึ่งของช่วงเวลาวิเคราะห์ ผ่านไปโดยไม่มีจุดสูงสุดใหม่/ต่ำสุดใหม่.
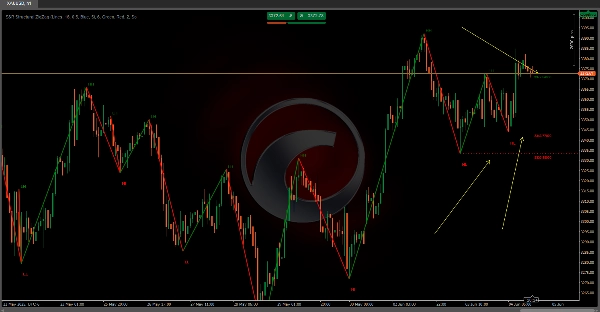
📉 วาดเส้นแนวโน้ม Zigzag
- เชื่อมต่อการแกว่งด้วยเส้นไดนามิก:
-
- 🟢 สีเขียว = แนวโน้มขาขึ้น (การแกว่งใหม่ > ก่อนหน้า).
- 🔴 สีแดง = แนวโน้มขาลง (การแกว่งใหม่ < ก่อนหน้า).
⏹️ เน้นระดับสำคัญ
- เส้นแนวรับ/แนวต้าน: วาดที่ราคาที่แน่นอนของแต่ละจุดแกว่ง ขยายไปทางขวา
- ป้ายแสดงค่าราคาที่ 📌 (เช่น "1.1050") เพื่อการวิเคราะห์ทันที.
🚦 เปิดเผยโครงสร้างตลาด
- ระบุแนวโน้มได้อย่างรวดเร็ว:
-
- ขาขึ้น = จุดสูงสุดสูงขึ้น (HH) + จุดต่ำสุดสูงขึ้น (HL).
- ขาลง = จุดสูงสุดต่ำลง (LH) + จุดต่ำสุดต่ำลง (LL).
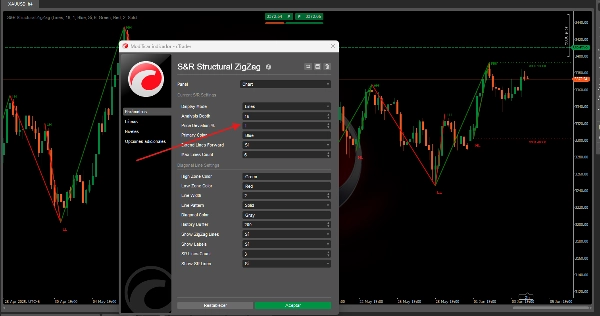
2. วิธีใช้ (คู่มือการตั้งค่า) ⚙️
ติดตั้งบน cTrader: ลากและวางลงบนกราฟของคุณ!
การตั้งค่าหลัก:
- ความลึกของการวิเคราะห์ 🔎:
10(ค่าเริ่มต้น) → ค่าที่สูงกว่าจะกรองเสียงรบกวน; ค่าที่ต่ำกว่าจะจับการแกว่งได้มากขึ้น. - เปอร์เซ็นต์การเบี่ยงเบนราคา 📏:
1.0%(ปรับได้) → การเปลี่ยนแปลงราคาขั้นต่ำเพื่อยืนยันการแกว่ง. - ป้ายการแกว่ง 🏷️ (HH/HL/LH/LL): เปิด/ปิด.
- ขยายเส้น ➡️: โปรเจกต์ระดับ S/R อย่างไม่จำกัดหรือจำกัดเฉพาะแท่งเทียนปัจจุบัน.
สรุป
รีวิวจากลูกค้า
5 | 100 % | |
4 | 0 % | |
3 | 0 % | |
2 | 0 % | |
1 | 0 % |


