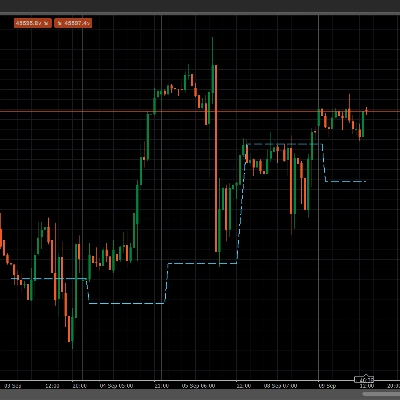
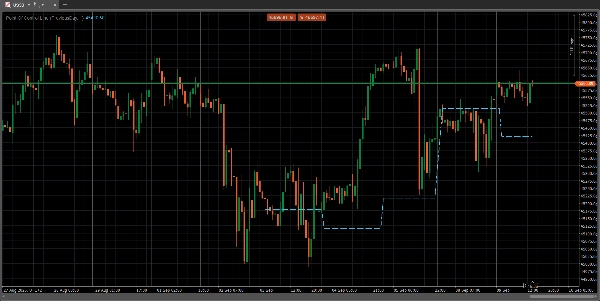
"POC Line lookback" logo
Indicator
Version 1.0, Sep 2025
Windows, Mac
"POC Line lookback" uploaded image
Since 21/04/2025

The Point of Control is a price level on a volume profile chart where the most trading volume has been conducted within a specified period. This level acts as a significant support or resistance zone because it represents a price where large trading institutions were most active and where market price found consensus. Traders use the line to identify key price zones, gauge market sentiment, and anticipate potential price movements and reversals

Indicator profile
0.0
Reviews: 0
Customer reviews
No reviews for this product yet. Already tried it? Be the first to tell others!
Forex
Indices
Products available through cTrader Store, including trading bots, indicators and plugins, are provided by third-party developers and made available for informational and technical access purposes only. cTrader Store is not a broker and does not provide investment advice, personal recommendations or any guarantee of future performance.

More from this author

Indicator
Forex
Indices
Displays the POC line for previous sessions in an easy to see manner.

You may also like

Indicator
AI
ATR
+27
Nadaraya-Watson Envelope Indicator
Indicator
Volume
Key Levels
+1
Tape Reading indicator ,book and flow analysis
Indicator
Prop
Forex
+11
Label each candle sequentially with flexible session resets.
Indicator
MACD
Key Levels
+2
Trend indicator with multi-timeframe filters, generating signals only on fully completed bricks & candles. No Repaint.
Indicator
AI
SMC
+7
The ultimate tool for Price Action and ICT. High, Low and Mid levels for days, weeks Inc. NY Midnight and Custom Range.
Indicator
Forex
Crypto
+2
PREMIUN INDICATOR
"LaguerreRSI" logo
Popular
5.0
(1)
$19
Indicator
Laguerre RSI: smoother, faster RSI with less noise. Great for spotting reversals and timing entries.
Indicator
Signal
Cumulative Volume Delta tracks the net difference in tick volume between buying and selling pressure over time
Indicator
AI
ATR
+27
Support and Resistance with signals
Indicator
AI
SMC
+19
Where price swings, volume speaks
Indicator
RSI
Signal
+1
🚀📈 Plot buy/sell signals on Range Bars using Moving Averages and RSI. Clear, actionable trading insights.🚀📈
Indicator
AI
Prop
+7
EMA Clouds, Multi-Timeframe (MTF) Overlay, Swing High/Low detection, and a smart Dashboard with neutral zone filtering.
Indicator
SMC
Signal
+2
Gold Market Maker Zones; Non-repainting Supply & Demand detector for XAUUSD. Precise institutional zones for cTrader.
Indicator
Support & Resistance
Multi-Timeframe exhaustion indicator. Detects trend loss with Doji filter & dynamic volatility.
Indicator
RSI
Prop
+14
Unlock Stochastic RSI PRO in cTrader! Overlay RSI, highlight zones, and identify divergences with customizable settings.
Indicator
VWAP
Volume
+2
VWAP Bands and Swing Wick Structure Indicator
Indicator
ATR
SMC
+15
VmmSignalAverage PRO Trial - Professional Pattern Detection Indicator.
Indicator
Flag
Key Levels
+5
Zig Zag filters out minor price noise and connects only the most significant swing and lows for key turning points.
Since 21/04/2025