Açıklama
🚀 10.000'den fazla trader zaten en iyi göstergelerimizi🏆 kullanıyor
👉 Tüm en iyi sistemlerimizi buradan edinin:
_______________________________________________
📌 Piyasa Yapısı Göstergeleri
· ✅ AdvancedMarket Structure: Bos, Choch, SwinLevels, Order Blocks, Market Structure& Likidite Bulucu
· 🔄 Dinamik Piyasa Yapısı Dönüş Noktalarının Analizi
· 🧱 Order Block
· ⚖️ Piyasa Dengesizliği
· ⛓️ BOS & CHOCH
· 🧠 ICT Güç 3
_______________________________________________
🔚 Akıllı Çıkış Sistemleri
· 📍 Takip Eden Akıllı Algoritma
_______________________________________________
📐 ZigZag Göstergeleri
· 🔍 ZigZag Fiyat Likidite Projeksiyonu
· ➖ ZigZag
· 🎯 Zig-Zag Uç Nokta Takipçisi
_______________________________________________
🧱 Destek & Direnç Göstergeleri
· 🟩 SmartTrend Destek & Direnç Çizgileri
· 🧱 Tüm Destek ve Direnç Seviyeleri
_______________________________________________
📊 Trend & Kanal Göstergeleri
· 📊 Süpertrend
· 🧠 Uyarlanabilir Trend Kanalı
· 🔁 Reaktif Hareketli Ortalama
_______________________________________________
💧 Hacim & Likidite Araçları
· 🔍 Momentum Adil Değer Boşluğu
· 🕒 Adil Değer Boşluğu Seansları
_______________________________________________
⚡ Momentum & RSI Göstergeleri
· 🔎 Çok Katmanlı Mum Eğilimi
Takipçisi
_______________________________________________
🔮 Tahmin & Projeksiyon Araçları
· 📏 Fibonacci Doğrusal Regresyon Çok Zamanlı
· 📈 Hacim Destekli Piyasa Akışı Projeksiyonu
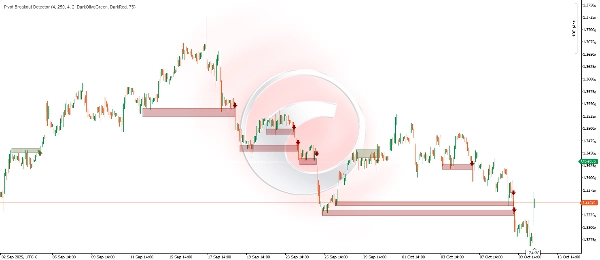
📊 Pivot Kopuş Dedektörü
🎯 **Nedir ve ne işe yarar?**
https://ctrader.chartshots.net/c/68e935cb9f52a
Pivot Kopuş Dedektörü, fiyat konsolidasyon bölgelerinden önemli kopuşları otomatik olarak tanımlamak için tasarlanmış gelişmiş bir teknik göstergedir. Bu gösterge, fiyatın tekrar tekrar "sekme" yaptığı (direnç veya destek oluşturduğu) alanları tespit etmek için piyasanın geçmiş davranışını analiz eder ve momentumlu bir kopuş gerçekleştiğinde sizi uyarır.
**Ana Kullanım Amacı:**
• Onaylanmış kopuşlarda işlem fırsatlarını belirlemek
• Çoklu temas doğrulaması ile sahte kopuşlardan kaçınmak
• Kritik dinamik destek ve direnç bölgelerini görselleştirmek
• Konsolidasyon sonrası patlayıcı hareketleri yakalamak
________________________________________
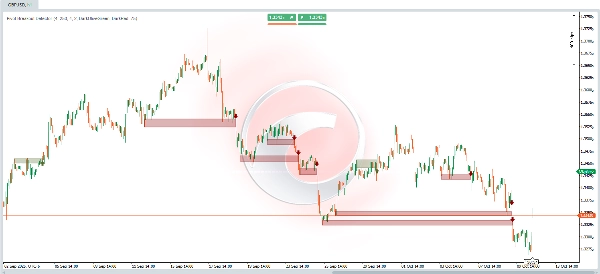
🔍 **Nasıl Çalışır? - Temel Mantık**
**Aşama 1: Önemli Pivotların Tespiti**
https://ctrader.chartshots.net/c/68e9368eb6e7c
Gösterge, fiyatın yön değiştirdiği yerleri temsil eden yerel yüksek ve düşük pivot noktalarını sürekli olarak grafik üzerinde tarar. Bu pivotlar önemlidir çünkü geçmişte alıcı veya satıcı ilgisinin olduğu seviyeleri işaret eder.
**Aşama 2: Konsolidasyon Bölgelerinin Belirlenmesi**
Pivotlar tespit edildikten sonra, gösterge bunları birbirine yakın olanları (ayar yapılabilir eşik içinde) gruplayarak konsolidasyon bölgesini belirler - fiyatın tekrar tekrar reddedildiği dar bir fiyat aralığı.
**Aşama 3: Kopuş Onayı**
Gösterge sabırla fiyatın şunları yapmasını bekler:
1. Belirlenen bölgenin üzerinde (boğa kopuşu) veya altında (ayı kopuşu) kapanış yapmak
2. Güçlü yönlü bir mum ile (açılıştan uzak kapanış)
3. Son kısa vadeli yüksek/düşük seviyeyi aşmak
**Aşama 4: Son Doğrulama**
Sinyal üretmeden önce şunları doğrular:
• Bölgede yeterli önceki "temas" var mı (ayar yapılabilir minimum)
• Fiyat yakın zamanda o seviyeyi aşmamış mı
• Kopuş mumunun açılışı geçerli aralık içinde mi
________________________________________
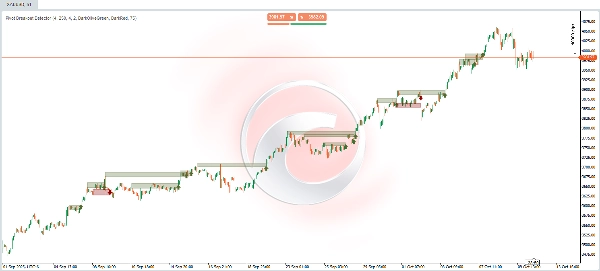
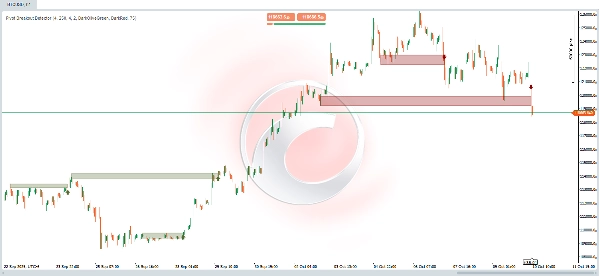
📈 **Görsel Yorumlama**
**Grafikteki Öğeler:**
🟢 **Zeytin Yeşili Dikdörtgenler (Boğa Kopuşu)**
• Gölgelendirilmiş yeşil alan: Aşılmış direnç bölgesini temsil eder
• Üst ve alt sınırlar: Önceki konsolidasyon bölgesini sınırlar
• Yatay uzantı: Bölgenin oluştuğu andan kopuş anına kadar gösterir
🔴 **Koyu Kırmızı Dikdörtgenler (Ayı Kopuşu)**span>
• Gölgelendirilmiş kırmızı alan: Kırılmış destek bölgesini temsil eder
• İşlev: Yeşil dikdörtgenlerle aynı, ancak ayı hareketleri için
⬆️ **Yeşil Yukarı Ok**
• Konum: Boğa kopuşunu onaylayan mumun altında
• Anlamı: Potansiyel uzun pozisyon sinyali (al)
• Yorum: Fiyat direnci güçlü şekilde kırdı
⬇️ **Kırmızı Aşağı Ok**
• Konum: Ayı kopuşunu onaylayan mumun üstünde
• Anlamı: Potansiyel kısa pozisyon sinyali (sat)
• Yorum: Fiyat desteği güçlü şekilde kırdı
________________________________________
⚙️ **Ayarlanabilir Parametreler**
1. **Swing Tespit Uzunluğu (Varsayılan: 4)**
• Kontrol ettiği: Önemli pivotları tespit etmek için analiz süresi
• Düşük değerler (2-3): Daha küçük ve sık pivotları tespit eder, daha fazla sinyal üretir ama potansiyel olarak daha fazla yanlış sinyal
• Yüksek değerler (7-10): Sadece büyük ve daha güvenilir pivotları tespit eder, daha az ama kaliteli sinyal üretir
• Tavsiye: Günlük işlemler için 4, swing işlemler için 8-10
2. **Bölge Geçmiş Çubukları (Varsayılan: 250)**
• Kontrol ettiği: Gösterge kaç mum geriye giderek pivotları hatırlayıp bölgeler oluşturur
• Düşük değerler (30-100): Yakın bölgeler üzerinde odaklanır, yapısal değişikliklere daha duyarlı
• Yüksek değerler (200-300): Daha eski tarihli bölgeleri dikkate alır, uzun vadeli seviyeleri belirlemek için faydalı
• Tavsiye: Gün içi zaman dilimleri için 150-200, günlük veya daha yüksek için 250-300
3. **Bölge Genişlik Yüzdesi (Varsayılan: %4)**
• Kontrol ettiği: Pivotları bir bölgeye gruplamak için "tolerans alanı" kalınlığı
• Düşük değerler (%1-2): Çok hassas bölgeler, neredeyse tam temaslar gerektirir
• Yüksek değerler (%5-8): Daha geniş bölgeler, yakın seviyeleri gruplarken daha hoşgörülü
• Tavsiye: Düşük volatilite enstrümanlar için %2-3 (forex majörleri), kripto paralar için %4-6
4. **Min Swing Temasları (Varsayılan: 2)**
• Kontrol ettiği: Bölgenin geçerli sayılması için fiyatın kaç kez "test" etmiş olması gerektiği
• Düşük değerler (1-2): Daha fazla sinyal, daha az sağlam bölgeler dahil
• Yüksek değerler (3-5): Sadece güçlü onaylanmış bölgeler, daha az ama daha güvenilir sinyal
• Tavsiye: Aktif işlemler için 2, daha muhafazakar pozisyonlar için 3-4
________________________________________
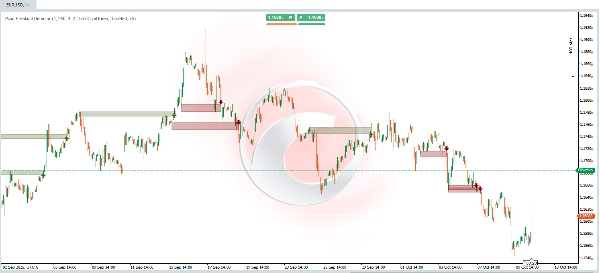
📊 **Pratik Örnekler**
🔵 **Boğa Kopuşu Örneği**
**Önceki Durum:** Fiyat birkaç seans boyunca $48.50 ile $49.20 arasında dalgalanıyordu. Bu konsolidasyon süresince, fiyat $49.00 seviyesini üç farklı kez aşmaya çalıştı ancak her seferinde reddedildi ve neredeyse aynı seviyede yüksek pivotlar oluşturdu.
**Bölge Oluşumu:** Gösterge, $48.90 ile $49.10 arasında yoğunlaşan bu üç yüksek pivotu otomatik olarak tanımlar ve iyi tanımlanmış bir "direnç bölgesi" oluşturur. Bu bölge, ilk temastan şu ana kadar yatay olarak uzanan yarı saydam zeytin yeşili bir dikdörtgen olarak çizilir.
**Kopuş Anı:** Mevcut seansta fiyat $48.80 açılır, güçlü bir şekilde yükselir ve $49.35'te kapanır. Bu mum tüm kriterleri karşılar:
• ✅ Direnç bölgesinin üzerinde kapanış yapar ($49.10)
• ✅ Güçlü bir boğa mumu (açılıştan oldukça yüksek kapanış)
• ✅ Son 4 mumun yüksek seviyesini aşar
• ✅ Bölge en az 2-3 kez onaylanmış temas aldı
**Oluşan Sinyal:** Kopuş mumunun altında yukarı bakan yeşil bir ok belirir ve zeytin yeşili dikdörtgen o anda "kapanır", tüm yapıyı görsel olarak gösterir: direncin oluştuğu yerden kırıldığı yere kadar.
**Trader Yorumu:** Bu potansiyel bir alış sinyalidir. Kopuş, alıcıların fiyatı tutan direnci nihayet aştığını ve daha sürdürülebilir bir boğa hareketinin başlayabileceğini gösterir. Traderlar şunları düşünebilir:
• Mum kapanışında veya kırılan bölgeye (şimdi destek) dönüşte uzun pozisyon açmak
• Bölgenin altında stop loss ($48.70)
• Bölgenin yüksekliği kadar yukarıya hedef belirlemek
________________________________________
🔴 **Ayı Kopuşu Örneği**
**Önceki Durum:** Fiyat neredeyse iki haftadır $102.00 civarında bir dağıtım aşamasındaydı. Dört farklı seferde fiyat $101.50'nin altına düşmeye çalıştı ancak alıcılar tarafından kurtarıldı ve çok dar bir bölgede düşük pivotlar oluşturdu.
**Bölge Oluşumu:** Gösterge, $101.40 ile $101.70 arasında gruplanmış bu dört düşük pivotu tespit eder ve net bir kurumsal "destek bölgesi" belirler. Bölge, bu seviyedeki savunmanın tüm geçmişini belgeleyen yarı saydam kırmızı bir dikdörtgenle işaretlenir.
**Kopuş Anı:** Volatil bir seansta fiyat $101.80 açılır, olumsuz haberler piyasayı etkiler ve fiyat $100.95'te kapanarak çöker. Bu kopuş mumu şunları gösterir:
• ✅ Destek bölgesinin altında net kapanış yapar ($101.40)
• ✅ Güçlü bir ayı mumu (açılışın oldukça altında kapanış)
• ✅ Son 4 seansın en düşüğünü kırar
• ✅ Destek daha önce 4 kez test edilmişti
**Oluşan Sinyal:** Kopuş mumunun üstünde aşağı bakan kırmızı bir ok belirir. Koyu kırmızı dikdörtgen tamamlanır ve tüm oluşum süreci ile destek çöküşünün tam noktası görsel olarak belgelenir.
**Trader Yorumu:** Bu potansiyel bir satış sinyalidir. Kopuş, satıcıların fiyatı destekleyen tabanı nihayet kırdığını ve ayı trendinin devam edebileceğini gösterir. Dikkate alınacaklar:
• Mum kapanışında veya kırılan bölgeye (şimdi direnç) başarısız dönüşte kısa pozisyon açmak
• Bölgenin üstünde stop loss ($102.00)
• Bölgenin yüksekliği kadar aşağıya hedef belirlemek
________________________________________
💡 **Kullanım İpuçları**
✅ **En İyi Uygulamalar:**
1. Hacimle onaylayın: Gerçek kopuşlar genellikle hacim artışı ile birlikte olur
2. Trend bağlamı: Ana trend yönündeki kopuşların başarı olasılığı daha yüksektir
3. Bekleme süresi: Tüm sinyaller hemen işlem yapılmamalıdır; gerekirse ek onay bekleyin
4. Risk yönetimi: Her zaman kırılan bölgenin yapısına göre stop loss kullanın
Özet
Key features include:
- Automatic detection of significant pivot points and consolidation zones.
- Breakout confirmation based on candle strength and price action.
- Validation requiring multiple prior touches of the zone to reduce false signals.
- Visual cues on the chart: olive green rectangles and upward arrows for bullish breakouts; dark red rectangles and downward arrows for bearish breakouts.
- Configurable parameters such as swing detection length, zone history depth, zone width, and minimum touches to tailor sensitivity and reliability.
The indicator supports various markets including Forex, cryptocurrencies, stocks, and major symbols like BTCUSD, EURUSD, GBPUSD, XAUUSD, and NAS100. It aids traders in spotting confirmed breakout opportunities, visualizing critical price levels, and managing risk with structural stop-loss placement.