present
가입하고 첫 구매 시 $50 할인을 받으세요
Trading product for HTFOverlayPlus 지표, image 1
HTFOverlayPlus
지표
161 다운로드
버전 1.0, Apr 2025
Windows, Mac
Trading product for HTFOverlayPlus 지표, image 2
가입일 10/02/2025
1.41K
무료 설치

설명

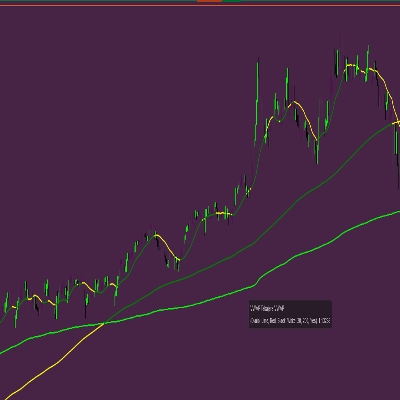
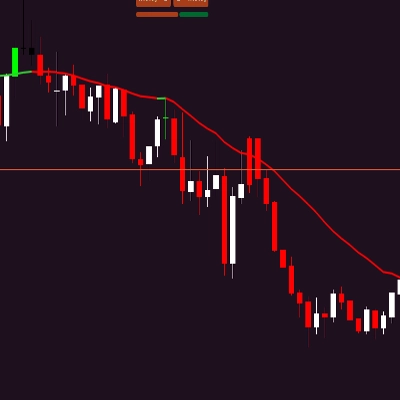
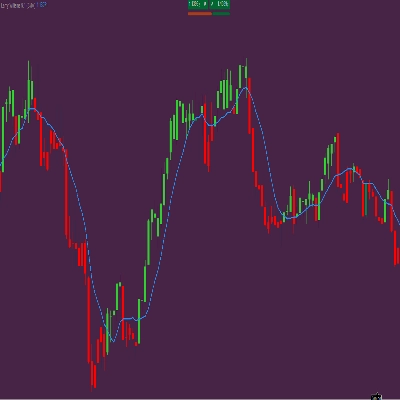
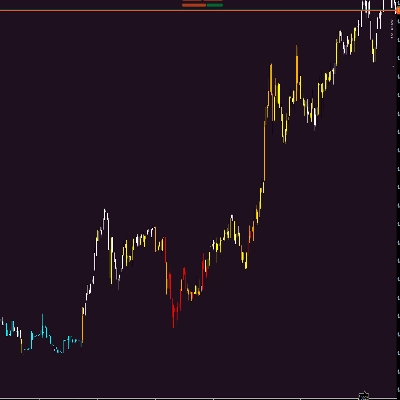
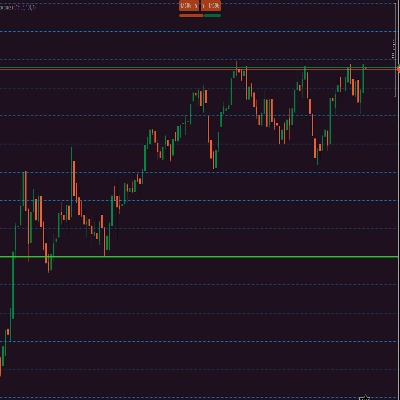
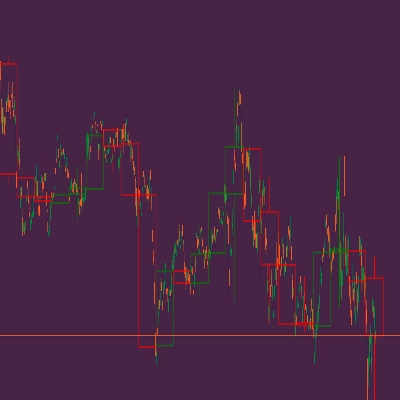
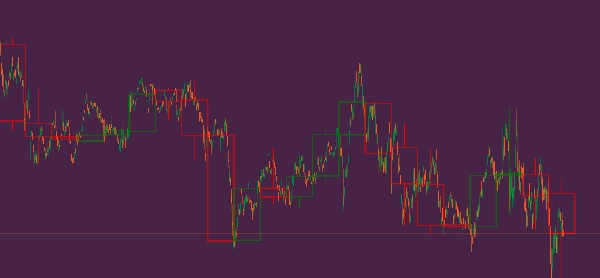
이 지표는 상위 타임프레임의 캔들을 현재 타임프레임 차트 위에 겹쳐서 표시합니다. 최대 50개의 상위 타임프레임 캔들을 시각화할 수 있으며, 가격 방향(상승 또는 하락)에 따라 캔들 색상을 조정합니다. 이 지표는 캔들 몸통의 테두리 두께와 상승 및 하락 캔들의 색상을 사용자 지정할 수 있는 기능을 제공합니다. 상위 타임프레임의 가격 움직임을 보면서 하위 타임프레임에서 거래하는 트레이더에게 유용하며, 보다 정확한 추세 분석을 가능하게 합니다. (참고: 타임프레임에서는 몸통이 보이지 않는 상태에서만 작동하며 나머지는 색칠만 합니다.)


이 지표는 상위 타임프레임의 캔들을 현재 차트 타임프레임 위에 겹쳐서 표시합니다. 최대 50개의 더 큰 타임프레임 캔들을 표시할 수 있으며, 가격 방향(강세 또는 약세)에 따라 캔들 색상을 조정합니다. 이 지표는 몸통 두께와 강세 및 약세 캔들의 색상을 사용자 지정할 수 있는 옵션을 제공합니다. 더 작은 타임프레임에서 거래하면서 상위 타임프레임의 가격 움직임을 시각화하고자 하는 트레이더에게 유용하며, 보다 정확한 추세 분석을 가능하게 합니다. (참고: 타임프레임에서 몸통이 보이지 않는 상태에서만 작동하며 나머지는 색칠만 합니다.)


이 지표는 상위 타임프레임의 캔들을 현재 타임프레임 차트에 겹쳐서 표시합니다. 최대 50개의 상위 타임프레임 캔들을 표시할 수 있으며, 가격 방향(상승 또는 하락)에 따라 캔들 색상을 조정합니다. 이 지표는 캔들 몸통 테두리 두께와 상승 및 하락 캔들의 색상을 사용자 지정할 수 있는 기능을 제공합니다. 상위 타임프레임의 가격 움직임을 보면서 하위 타임프레임에서 거래하는 트레이더에게 유용하며, 보다 정확한 추세 분석을 가능하게 합니다. (참고: 타임프레임에서 몸통이 보이지 않는 상태에서만 작동하며 나머지는 색칠만 합니다.)

요약

AI summary
HTFOverlayPlus is a trading indicator that overlays candlesticks from a higher time frame onto the chart of the current, lower time frame. It can display up to 50 candles from the larger time frame, with candle colors dynamically adjusted to reflect price direction—bullish or bearish. Users can customize the thickness of the candle body borders as well as the colors for bullish and bearish candles. This functionality enables traders to monitor higher time frame price action while operating on smaller time frames, facilitating more precise trend analysis. The indicator requires the higher time frame candles to have an invisible body on the current chart, with the rest of the candle elements visually painted.
지표 프로필

고객 리뷰

0.0
리뷰: 0
고객 리뷰
이 상품에 대한 리뷰가 아직 없습니다. 이미 사용해 보셨나요? 다른 사람들에게 가장 먼저 소개해 주세요!

상담

자주 묻는 질문(FAQ)

트레이딩 봇, 지표, 플러그인 등 cTrader Store에서 제공되는 상품은 제3자 개발자에 의해 제공되며, 이는 단순히 정보 및 기술적 접근을 목적으로 제공된 것입니다. cTrader Store는 중개인이 아니며, 투자 조언, 개인별 추천 또는 향후 성과에 대한 어떠한 보장도 제공하지 않습니다.

이 작성자의 상품 더 보기

지표
VWAP
VWAP Tabajara
지표
Larry Williams 9.1
지표
corrigido todos os bugs e cores invertidas tabajara antigo deleetado

좋아하실 만한 다른 항목

지표
AI
ATR
+13
Liquidity Pressure Index is a tool that gives traders deeper insights into the hidden dynamics of market liquidity
지표
ADX
ATR
+2
GOLD SENTINEL v1.0 - A CANDLE-COLORING INDICATOR FOR GOLD.
지표
RSI
Forex
+4
😎Read the description before purchasing💩
지표
SMA
Market Structure
ICT Power of 3 AMD
지표
Supertrend
Moving Average
Easy Trade: Trend & Breakout Indicator for cTrader
지표
BOS
MSS
+3
Orderblocks with Multi-Timeframe.
지표
BOS
CHOCH
+5
A professional-grade cTrader indicator for traders following the Inner Circle Trader (ICT) methodology.
지표
Smart Liquidity Zones PRO auto-detects liquidity grabs, wicks, traps & manipulations — trade like the smart money.
"ORB v1" 로고
인기
5.0
(3)
$19
지표
Breakout
Opening Range Breakout (ORB) - Visual Edition
지표
BOS
CHOCH
+5
BOS/CHoCH signals confirmed by liquidity sweep + FVG confluence, with a live conviction score.
지표
ATR
Channel
+1
Bollinger Bands Advanced Squeeze & Breakout System, Real-Time On-Chart Dashboard, Auto-Squeeze Detector, Dual-Band Cloud
지표
Imbalance
Fair Value Gap
+1
Multi-symbol, multi-timeframe Fair Value Gaps in one panel.
지표
Larry Williams 9.1
지표
ADX
ATR
+5
Configure, simulate, and analyze trading strategies with custom filters, multi-target exits, and detailed performance me
지표
ATR
MSS
+5
Advanced market structure and institutional cycle mapper with visual reference cards and entry alerts
지표
RSI
Breakout
+1
Connects each moving average value from candle to candle, forming a fan-like structure of trendlines.
지표
AI
RSI
+18
Session boxes with UTC offset, OR logic, adjustable opacity, and multi-day lookback.
지표
Forex
Fibonacci
+2
Enhance your trading with customizable alerts and dynamic visual tools for trendlines, Fibonacci levels, and more.

가격

가입일 10/02/2025
1.41K
무료 설치