설명
📈 Trend Master Pro MultiMA – 궁극의 추세 감지 도구 🚀
이 지표는 20개의 이동평균선을 서로 다른 기간 (5, 10, 15, 20, 25, 30, 35, 40, 45, 50, 55, 60, 65, 70, 75, 80, 85, 90, 95, 그리고 100)으로 표시합니다. 각각에 대해:
1️⃣ 📊 계산 유형 선택: 선호에 따라 SMA, EMA, RMA, WMA, 또는 VWMA 중에서 선택하세요. 선택적으로 선형 회귀 평활화를 활성화하여 노이즈를 줄이고 더 명확한 추세를 얻을 수 있습니다.
2️⃣ 📏 기준 채널 정의: 마지막 200개의 캔들을 사용하여 가격 범위 기반 채널이 계산됩니다. 채널 폭은 조절 가능하며, 가격 변동성이 클 때 확장되고 시장이 안정적일 때 축소됩니다.
3️⃣ 📈 이동평균선과 채널 비교: 각 이동평균선은 채널 높이와 정의된 기간(기본값: 20개의 캔들) 동안의 자체 최고점 및 최저점과 관련하여 분석됩니다.
- 📊 이동평균선의 최고값과 최저값 차이가 채널 폭을 초과하면, 이는 강한 추세(상승 또는 하락)을 나타냅니다.
- ⚖️ 차이가 채널 내 또는 채널에 근접하면, 시장은 중립 또는 횡보로 간주됩니다.
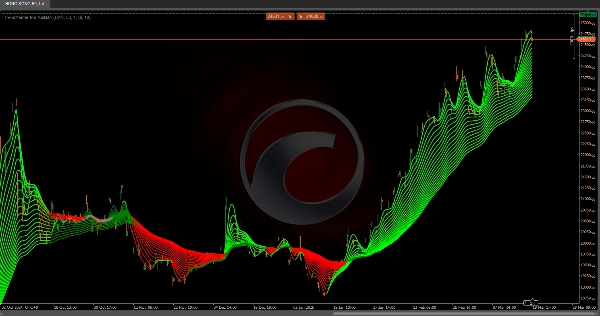
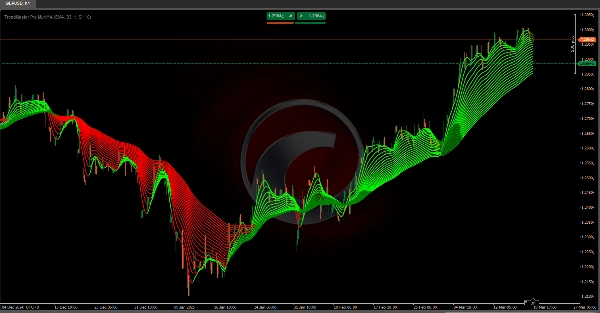
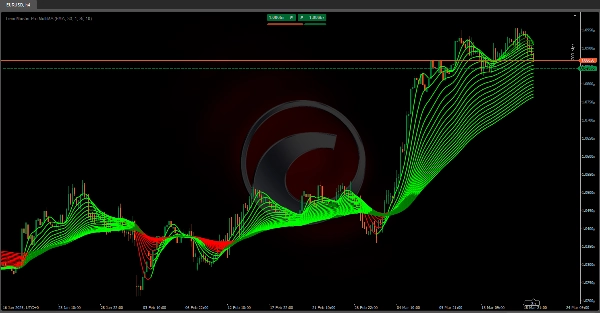
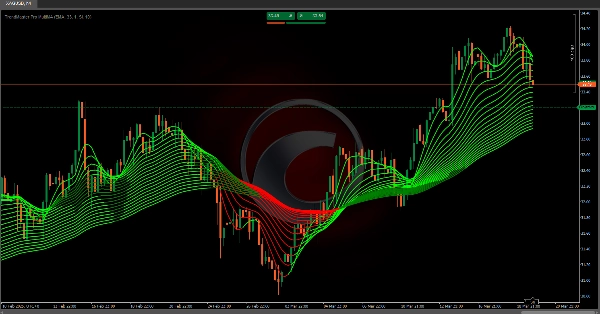
4️⃣ 🎨 추세 기반 색상 시스템: 이동평균선의 각 구간은 추세 강도와 방향에 따라 색칠됩니다:
- 🟢 녹색 = 상승 추세 감지
- 🔴 빨간색 = 하락 추세 감지
5️⃣ 📉 추세 시각화: 이 지표는 각 이동평균선 값을 캔들 간 연결하여 추세선의 부채꼴 구조를 형성합니다. 각 이동평균선은 계산된 추세에 따라 동적으로 색상이 조정됩니다.
✅ 왜 Trend Master Pro MultiMA를 사용해야 할까요?
이 다중 시간대 적응형 접근법—여러 이동평균선, 가격 채널, 회귀 평활화를 결합하여—시장 단계를 빠르게 식별하는 데 도움을 줍니다:
🔹 상승 추세 ✅
🔹 하락 추세 ❌
🔹 횡보/측면 움직임 🔄
🚀 단기, 중기, 장기 시간대에서 더 나은 결정을 내리기 위한 명확한 시각적 통찰력을 찾는 트레이더에게 완벽한 도구입니다! 📊🔥
Ctrader 스토어 지표:
Dynamic Market Structure
Analysis of Turning Points
Fibonacci Linear
Regression Multi-timeframe
Multi-Level Candle Bias
Tracker
Auto Support and
Resistance Trend Lines
요약
Each moving average is compared against this channel and its own highs and lows over a defined period (default 20 candles). If the range of a moving average exceeds the channel width, it signals a strong bullish or bearish trend; if within or near the channel, the market is considered neutral or ranging. The indicator visually represents trends by connecting moving average values candle-to-candle, forming a fan-like structure of trendlines. Trend strength and direction are indicated by color coding: green for bullish and red for bearish trends.
This multi-timeframe adaptive tool integrates multiple moving averages, price channels, and regression smoothing to help traders quickly identify market phases—bullish, bearish, or ranging—across short, medium, and long-term timeframes.
고객 리뷰
5 | 100 % | |
4 | 0 % | |
3 | 0 % | |
2 | 0 % | |
1 | 0 % |