

Descrizione
indicatore che colora le candele in tempo reale basandosi sulla struttura del mercato e disegna zone di liquidità, flussi istituzionali e intervalli di consolidamento. Progettato per trader che operano secondo i principi Smart Money Concepts (SMC).
🧠 Logica dell'algoritmo
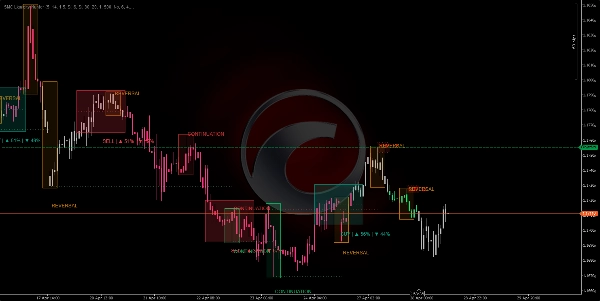
https://chartshots.spotware.com/c/69f0e3fd81319
1. Rilevamento della struttura di mercato 🔍
- Trova i pivot (massimi e minimi locali) usando un periodo di lookback configurabile.
- Confronta pivot consecutivi per determinare la struttura:
-
- Massimi più alti + Minimi più alti = Bias rialzista 📈
- Massimi più bassi + Minimi più bassi = Bias ribassista 📉
- Segnali misti = Bias neutro ➡️
- Filtra il rumore: conta solo i pivot che si spostano oltre una soglia basata sull'ATR (Average True Range) moltiplicato per una sensibilità regolabile.
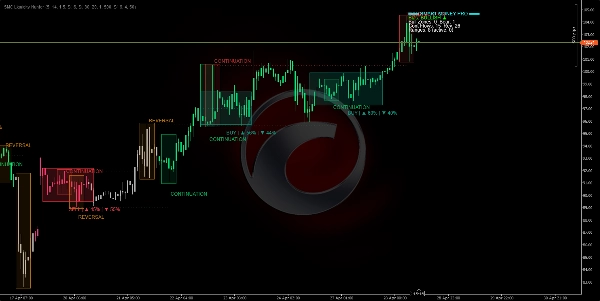
https://chartshots.spotware.com/c/69f0e7e752b74
2. Flussi istituzionali (Flow Boxes) 🔄
- Ogni volta che si forma un nuovo pivot significativo, l'algoritmo disegna una linea orizzontale dal pivot precedente a quello nuovo.
- Classifica il flusso come:
-
- Continuazione: il prezzo rispetta il trend (HL in uptrend, LH in downtrend) ✅
- Inversione: il prezzo rompe la struttura (LL in uptrend, HH in downtrend) ⚠️
- Disegna una scatola colorata intorno al pivot etichettata "CONTINUAZIONE" o "INVERSIONE".
3. Zone di Offerta/Domanda (Liquidità) 💧
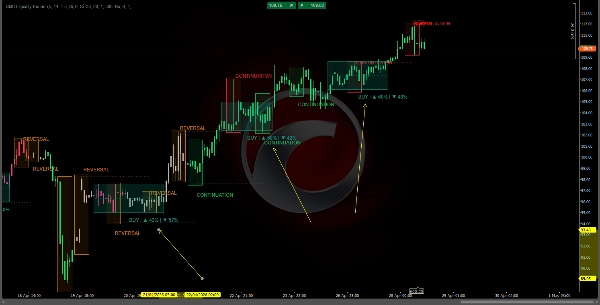
https://chartshots.spotware.com/c/69f0e8e7aef29
- Intorno a ogni pivot significativo, viene disegnata una fascia orizzontale che si estende nel futuro per un numero configurabile di barre.
- Queste zone rappresentano ordini istituzionali non eseguiti:
-
- Pivot ribassisti → zona di OFFERTA (ordini di vendita) 🔴
- Pivot rialzisti → zona di DOMANDA (ordini di acquisto) 🟢
- Una zona si rompe e scompare quando il prezzo la penetra con sufficiente forza o quando la sua durata scade.
4. Motore di rilevamento degli intervalli (Consolidamenti) 📦
- Calcola una Media Mobile Semplice (SMA) con una banda ATR intorno ad essa.
- Se ogni singola barra all'interno di una finestra di lookback rimane dentro la banda, l'algoritmo identifica un intervallo di consolidamento.
- Disegna un rettangolo blu con:
-
- Linea mediana tratteggiata (equilibrio dell'intervallo) ⚖️
- Percentuale di probabilità di breakout rialzista/ribassista basata su:
-
- Momentum direzionale (ADX/DI+ vs DI-) 📐
- Volume cumulativo rialzista vs ribassista all'interno dell'intervallo 📊
- Tempo trascorso nella metà superiore vs inferiore ⏱️
5. Colorazione delle candele (Pulita e Visiva) 🕯️
- Candela verde = struttura rialzista confermata (HH+HL) 🟢
- Candela magenta/rossa = struttura ribassista confermata (LH+LL) 🔴
- Candela grigia = fase neutra o di transizione ⚪
- Nessun rettangolo sovrapposto: stoppini e corpi reali sono sempre completamente visibili.
📋 Dashboard (angolo)
Riepilogo numerico di zone attive, flussi e intervalli
🛠️ Come usarlo
⚙️ Impostazioni consigliate
- Timeframe: H1 o superiore (ideale per Smart Money).
- Parametri predefiniti: funzionano bene per Forex, indici e crypto.
- Regola la sensibilità: aumentala per mercati volatili, diminuiscila per mercati laterali agitati.
📗 Regole di trading :
✅ Entrata Long (ACQUISTA)
- Le candele devono essere verdi (bias rialzista attivo) 🟢
- Il prezzo tocca o si avvicina a una zona "DOMANDA" attiva 🟢
- Compare una scatola "CONTINUAZIONE" (non "INVERSIONE") in quella zona ✅
- La dashboard mostra probabilità di breakout rialzista > 60% sull'intervallo attivo (se presente) 📊
✅ Entrata Short (VENDI)
- Le candele devono essere magenta/rosse (bias ribassista attivo) 🔴
- Il prezzo tocca o si avvicina a una zona "OFFERTA" attiva 🔴
- Compare una scatola "CONTINUAZIONE" (non "INVERSIONE") in quella zona ✅
- La dashboard mostra probabilità di breakout ribassista > 60% 📊
❌ Non fare trading se...
- Le candele sono grigie (nessun bias definito) ⚪
- Compare un segnale "INVERSIONE" proprio dove stavi per entrare ⚠️
- Il prezzo è all'interno di un intervallo blu senza breakout chiaro ancora 🔵
- La dashboard mostra confluenza opposta (confluenza ribassista in setup rialzista, o viceversa) 🔄
📈 Interpretazione della dashboard
testo
═══ SMART MONEY PRO ═══
Bias: RIALZISTA ▲ ← Bias di mercato attuale
Zone rialziste: 2 Ribassiste: 1 ← Zone di liquidità attive
Flussi cont: 3 Inv: 0 ← Continuazioni vs inversioni
Intervalli: 4 (attivi: 1) ← Totale e intervalli attivi
Intervallo attivo ▲65% ▼35% ← Probabilità di breakout
⚡ CONFLUENZA RIALZISTA ← Segnale di massimo allineamento
💡 Principi chiave
- ✅ Nessun repaint: tutto è calcolato usando solo dati di barre chiuse.
- ✅ Grafico pulito: candele reali colorate, zone semi-trasparenti, nessun ingombro visivo.
- ✅ Anteprima della struttura: il colore della candela indica la fase di mercato prima che i pivot siano evidenti.
- ✅ Confluenza integrata: quando zona attiva + intervallo attivo + segnale di flusso si allineano, la dashboard lo segnala esplicitamente.
Riepilogo
Key features include:
- **Institutional Flows:** Draws horizontal lines and colored boxes between significant pivots, labeling flows as "CONTINUATION" or "REVERSAL" to indicate trend respect or break.
- **Supply and Demand Zones:** Highlights unexecuted institutional orders with horizontal bands around pivots, distinguishing supply (sell) and demand (buy) zones that expire or break upon price penetration.
- **Range Detection:** Identifies consolidation ranges using an SMA with ATR bands, marking them with blue rectangles and providing breakout probability percentages based on momentum, volume, and time distribution.
- **Dashboard:** Displays numeric summaries of active zones, flows, ranges, and breakout probabilities, including confluence signals when multiple factors align.
Recommended for use on H1 or higher timeframes, the indicator suits Forex, indices, and cryptocurrencies. It operates without repainting by relying on closed bar data and maintains a clean chart presentation with visible candle wicks and bodies.
Recensioni dei clienti
5 | 50 % | |
4 | 25 % | |
3 | 0 % | |
2 | 25 % | |
1 | 0 % |






























