
Descrição
CVD Proporcional Clássico (Ancorado)
Desbloqueie a verdadeira intenção dos participantes do mercado com o CVD Proporcional Clássico. Diferente dos indicadores padrão de Delta de Volume Acumulado que simplesmente somam o volume de ticks, esta ferramenta usa uma Lógica Proporcional para ponderar o volume com base na ação real do preço dentro de cada barra.
Por que Delta "Proporcional"?
O CVD padrão pode ser enganoso. Este indicador calcula o delta analisando a relação entre o Alcance da Barra (Alta-Baixa) e a distância Fechamento-Abertura. Isso garante que o volume seja distribuído de forma realista:
- Velas de forte convicção (fechando próximo da alta/baixa) contribuem mais para o delta.
- Velas com pavios longos (sinais de absorção ou rejeição) neutralizam o delta, prevenindo sinais "falsos" de volume.
Principais Características
- ⚓ Ancoragem Inteligente (Reset Multi-Temporal): Mantenha sua análise relevante para a sessão de negociação atual. Escolha redefinir o cálculo Diariamente, Semanalmente ou Mensalmente—ou mantenha-o rodando indefinidamente.
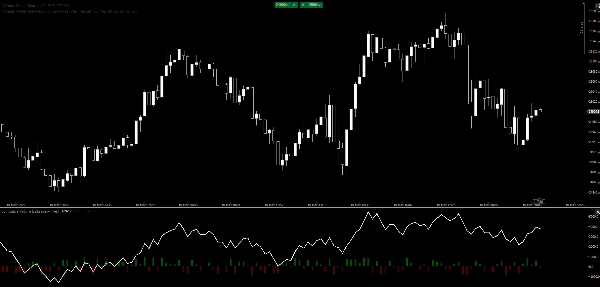
- 📊 Visuais Duplos:
-
- A Linha CVD: Uma linha limpa e de alto desempenho para identificar divergências de longo prazo e exaustão de tendência.
- Sobreposição de Histograma: Feedback visual instantâneo sobre a pressão de compra/venda por barra para identificar clímax ou absorção rapidamente.
- ⚡ Ultra-Leve: Desenvolvido com otimização nativa em C# para cTrader, garantindo zero atraso mesmo em máquinas de baixo desempenho ou mercados voláteis.
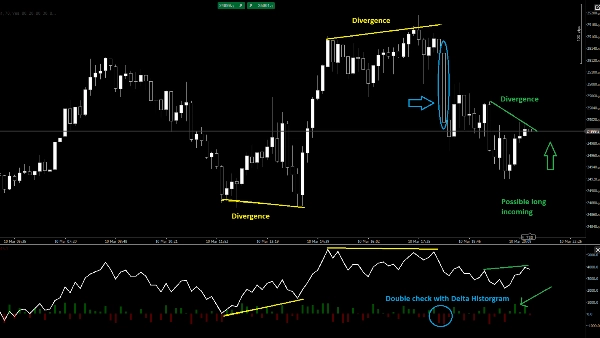
- 🎯 Identificação de Divergências: Identifique facilmente quando o preço faz novas máximas enquanto o CVD falha—um sinal clássico de distribuição institucional.
Como Operar com Ele
- Confirmação de Tendência: Observe a linha CVD seguindo a mesma direção do preço.
- Absorção: Quando o preço atinge uma nova baixa, mas o Histograma CVD mostra forte "Delta Up" (Verde), os compradores estão absorvendo a pressão de venda.
- Exaustão: Observe um pico acentuado no histograma (Clímax) seguido por uma reversão na linha CVD.
Parâmetros:
- Modo de Ancoragem: Nunca, Diariamente, Semanalmente, Mensalmente.
- Mostrar Delta da Barra: Ative ou desative o histograma.
Desbloqueie a verdadeira intenção dos participantes do mercado com o CVD Proporcional Clássico. Diferente dos indicadores padrão de Delta de Volume Acumulado que simplesmente somam o volume de ticks, esta ferramenta usa uma Lógica Proporcional para ponderar o volume com base na ação real do preço dentro de cada barra.
Por que Delta "Proporcional"?
O CVD padrão pode ser enganoso. Este indicador calcula o delta analisando a relação entre o Alcance da Barra (Alta-Baixa) e a distância Fechamento-Abertura. Isso garante que o volume seja distribuído de forma realista:
- Velas de forte convicção (fechando próximo da alta/baixa) contribuem mais para o delta.
- Velas com pavios longos (sinais de absorção ou rejeição) neutralizam o delta, prevenindo sinais "falsos" de volume.
Principais Características
- ⚓ Ancoragem Inteligente (Reset Multi-Temporal): Mantenha sua análise relevante para a sessão de negociação atual. Escolha redefinir o cálculo Diariamente, Semanalmente ou Mensalmente—ou mantenha-o rodando indefinidamente.
- 📊 Visuais Duplos:
-
- A Linha CVD: Uma linha limpa e de alto desempenho para identificar divergências de longo prazo e exaustão de tendência.
- Sobreposição de Histograma: Feedback visual instantâneo sobre a pressão de compra/venda por barra para identificar clímax ou absorção rapidamente.
- ⚡ Ultra-Leve: Desenvolvido com otimização nativa em C# para cTrader, garantindo zero atraso mesmo em máquinas de baixo desempenho ou mercados voláteis.
- 🎯 Identificação de Divergências: Identifique facilmente quando o preço faz novas máximas enquanto o CVD falha—um sinal clássico de distribuição institucional.
Como Operar com Ele
- Confirmação de Tendência: Observe a linha CVD seguindo a mesma direção do preço.
- Absorção: Quando o preço atinge uma nova baixa, mas o Histograma CVD mostra forte "Delta Up" (Verde), os compradores estão absorvendo a pressão de venda.
- Exaustão: Observe um pico acentuado no histograma (Clímax) seguido por uma reversão na linha CVD.
Parâmetros:
- Modo de Ancoragem: Nunca, Diariamente, Semanalmente, Mensalmente.
- Mostrar Delta da Barra: Ative ou desative o histograma.
Resumo
Key features include smart anchoring with multi-timeframe resets (daily, weekly, monthly, or continuous), dual visuals comprising a CVD line for spotting divergences and trend exhaustion, and a histogram overlay for immediate per-bar buying or selling pressure insights. The indicator is optimized in native C# for cTrader, ensuring high performance and low resource use.
Traders can use the indicator for trend confirmation by aligning CVD direction with price, identify absorption when price lows coincide with strong positive delta in the histogram, and detect exhaustion through histogram spikes followed by CVD reversals. Adjustable parameters include anchor mode and histogram display toggle.
This tool supports analysis across multiple markets and symbols, including Forex, cryptocurrencies, indices, commodities, and stocks.
Avaliações de clientes
5 | 0 % | |
4 | 100 % | |
3 | 0 % | |
2 | 0 % | |
1 | 0 % |


