
说明
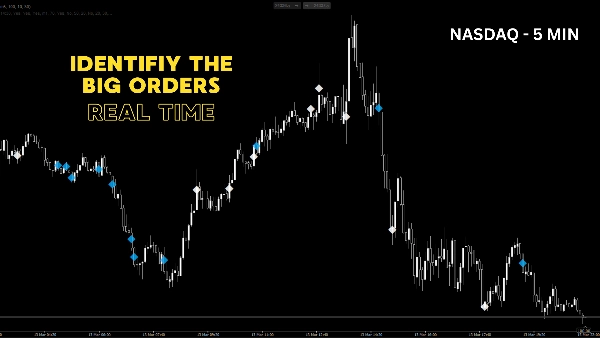
异常成交量簇 是一个为cTrader设计的高精度成交量分析工具,用于揭示机构足迹和极端交易活动。成交量先于价格,该指标准确显示“聪明资金”进入市场的位置。
该指标不是依赖固定的静态成交量阈值,而是使用了 动态滚动百分位逻辑。它分析近期历史,仅突出显示成交量真正异常的蜡烛(例如,过去200个周期中成交量最高的5%)。
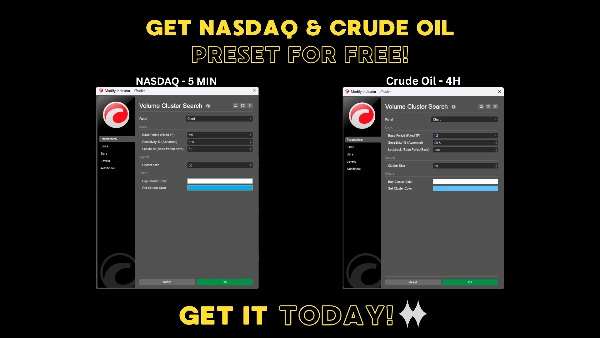
其一个巨大优势是 多时间框架(MTF)功能:您可以在5分钟图上交易,同时指标静默监控更高的“基准周期”(如1小时图)中的成交量激增,将这些关键簇直接投射到您的低时间框架图表上,准确显示它们发生的位置。
🔥 主要特点:
- 动态灵敏度: 使用滚动百分位阈值(例如95%),自动适应安静和高度波动的市场条件。
- 真正的多时间框架: 通过使用更高的基准时间框架过滤市场噪音,同时保持低时间框架上的入场点精准。
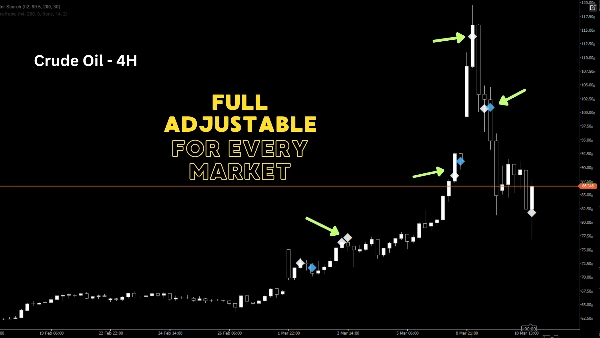
- 方向性簇: 极端成交量事件以钻石标记(◆)绘制在中位价上。绿色表示看涨收盘,红色表示看跌收盘。
- 高度优化: 内置内存管理(最多2000个绘制对象)确保您的cTrader平台保持极速响应。
- 完全可定制: 调整回溯周期、灵敏度(%)、基准时间框架、簇大小和颜色,以适应您的个人交易风格。
💡 如何使用?
异常成交量通常表示两种情况之一:大规模趋势启动(突破)或投降/吸收(反转)。通过识别这些簇,您可以基于实际交易的资金量而非仅仅价格行为,识别隐藏的支撑和阻力区域。非常适合日内交易者、剥头皮交易者、波段交易者和成交量行为交易者寻找真正优势。
摘要
指标配置
客户评价
3.6
评价:3
5 | 0 % | |
4 | 67 % | |
3 | 33 % | |
2 | 0 % | |
1 | 0 % |
客户评价
April 3, 2026
After value area, the useful part became clearer. POC and VWAP was enough to see whether it helped, and 20 reactions kept the test grounded. The next review on it on value area.
April 2, 2026
Better for someone who wants less noise in the process. The best use is checking participation and pressure, then leaving the final filter manual. Starting light makes the result less emotional.
April 1, 2026
This is easier to judge on H1. A sample of 97 setups with 20 reactions gives a cleaner read than one good result.
讨论
常见问答
Breakout
Scalping
Indices
Fair Value Gap
SMC
XAUUSD
NAS100
cTrader Store 提供的所有产品,包括交易机器人、指标和插件,均由第三方开发者提供,仅供信息参考和技术访问之用。cTrader Store 并非经纪商,不提供投资建议、个人推荐或任何未来业绩保证。
该作者的其他作品


价格
注册日期 09/05/2025
5
销售