
Penerangan
✔ Laman web untuk memasukkan data, masukkan tab penunjuk: https://tradingeconomics.com/
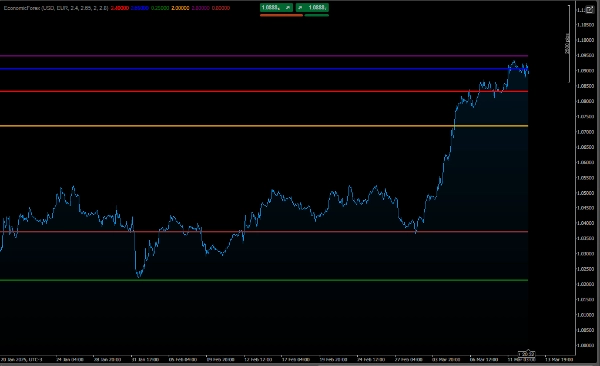
Cara Mentafsirkan Graf
Perbezaan antara Kadar Faedah Nominal dan Sebenar:
Kadar faedah nominal adalah nilai kasar kadar faedah.
Kadar faedah sebenar mengambil kira inflasi, menunjukkan kuasa beli sebenar wang.
Jika inflasi lebih tinggi daripada kadar faedah nominal, kadar faedah sebenar akan menjadi negatif, menunjukkan kehilangan kuasa beli.
Perbandingan Mata Wang:
Graf membolehkan anda membandingkan keadaan ekonomi kedua-dua mata wang.
Sebagai contoh, jika kadar faedah sebenar mata wang utama lebih tinggi daripada mata wang lawan, ini mungkin menunjukkan bahawa mata wang utama lebih menarik untuk pelaburan.
Perkembangan Sepanjang Masa:
Garis menunjukkan bagaimana inflasi, kadar faedah nominal dan kadar faedah sebenar berubah sepanjang masa, membolehkan anda mengenal pasti trend.
Contoh Penggunaan
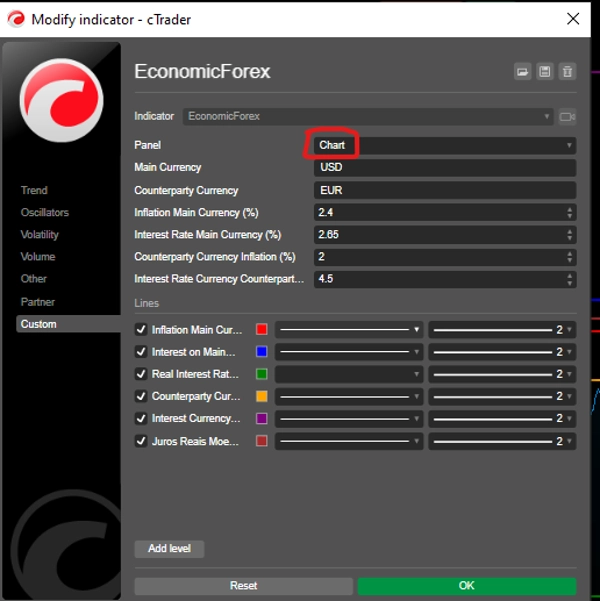
Andaian anda menetapkan parameter seperti berikut:
Mata Wang Utama: USD (Dolar AS)
Inflasi: 5%
Kadar Faedah Nominal: 6.5%
Mata Wang Lawan: EUR (Euro)
Inflasi: 2%
Kadar Faedah Nominal: 4%
Carta akan menunjukkan:
USD:
Faedah Sebenar: 1.5% (6.5% - 5%)
EUR:
Faedah Sebenar: 2% (4% - 2%)
Dengan ini, anda boleh membandingkan keadaan ekonomi USD dan EUR serta membuat keputusan yang berinformasi dalam pasaran forex.
Kesimpulan
Kod ini adalah alat berguna untuk pedagang dan penganalisis yang ingin memantau dan membandingkan penunjuk ekonomi dua mata wang dalam pasangan forex. Ia memberikan pandangan tentang inflasi, kadar faedah nominal, dan kadar faedah sebenar, membantu memahami senario makroekonomi dan implikasinya untuk pasaran forex.
lihat algoritma risiko rendah ini:👇🏻
https://ctrader.com/pt/products/601?u=carneiroads
https://ctrader.com/pt/products/623?u=carneiroads
Ringkasan
The indicator distinguishes between nominal interest rates (the gross interest rate) and real interest rates (adjusted for inflation), highlighting the purchasing power of money. It allows comparison of economic conditions between a main currency and a counterparty currency by plotting their respective inflation, nominal, and real interest rates over time. This helps identify trends and relative investment attractiveness; for example, a higher real interest rate in the main currency compared to the counterpart may indicate greater investment appeal.
Users input data such as inflation and nominal interest rates for each currency, which can be sourced from economic data websites like TradingEconomics.com. The tool supports informed decision-making in the forex market by providing a clear view of evolving economic factors affecting currency pairs.


