
Penerangan
Penjelasan Strategi Mengikuti Trend Forex (Bahasa Inggeris)
Strategi mengikuti trend ini direka untuk mengenal pasti trend pasaran yang kuat menggunakan Purata Pergerakan Eksponen (EMA), MACD, dan ADX. Ia menghasilkan isyarat beli dan jual berdasarkan momentum dan kekuatan trend.
Cara Ia Berfungsi
1️⃣ Mengenal Pasti Arah Trend
- EMA Pantas (21) dan EMA Perlahan (50) menentukan arah trend keseluruhan:
-
- Trend Bullish → EMA Pantas berada di atas EMA Perlahan
- Trend Bearish → EMA Pantas berada di bawah EMA Perlahan
2️⃣ Mengukur Momentum Trend (Histogram MACD)
- Histogram MACD mengesahkan momentum:
-
- Momentum Bullish → Histogram MACD berada di atas sifar
- Momentum Bearish → Histogram MACD berada di bawah sifar
3️⃣ Memeriksa Kekuatan Trend (Penunjuk ADX)
- ADX (14) mengukur kekuatan trend:
-
- Trend Kuat → ADX berada di atas 25
- Trend Lemah → ADX berada di bawah 25 (tiada isyarat)
Pelaksanaan Dagangan
✅ Isyarat Beli (Masuk Bullish)
- EMA Pantas > EMA Perlahan (Trend menaik)
- Histogram MACD > 0 (Pengesahan momentum)
- ADX > 25 (Trend kuat)
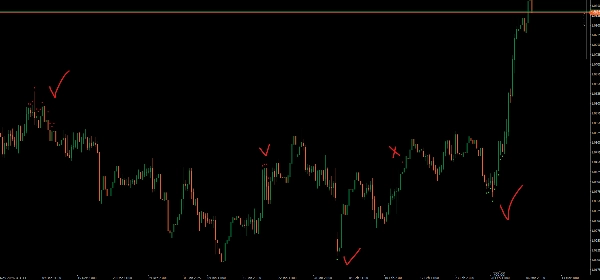
- 🔹 Anak panah beli muncul di bawah harga rendah
❌ Isyarat Jual (Masuk Bearish)
- EMA Pantas < EMA Perlahan (Trend menurun)
- Histogram MACD < 0 (Pengesahan momentum)
- ADX > 25 (Trend kuat)
- 🔻 Anak panah jual muncul di atas harga tinggi
Ciri-ciri Utama
✔ Mengelakkan trend lemah menggunakan ADX
✔ Menapis isyarat palsu dengan pengesahan MACD
✔ Parameter boleh laras untuk penyesuaian yang lebih baik
Penunjuk ini membantu pedagang mengikuti trend yang kuat sambil mengelakkan keadaan pasaran yang lemah. 🚀


