
Mô tả
🌟 **Z-Score là gì?** 🌟
• **Z-Score trong Giao dịch**: Đây là cách đo khoảng cách giá hiện tại so với trung bình gần đây, được biểu thị bằng số độ lệch chuẩn. 😊 Giá trị gần 0 cho thấy giá gần với trung bình, trong khi các giá trị cao (dương hoặc âm) 😮 cho thấy giá đã lệch đáng kể.
• **Ứng dụng Thống kê**: Những giá trị này giúp bạn xác định các tình huống giá bị "quá mua" 📈 hoặc "quá bán" 📉, điều này hữu ích cho các chiến lược hồi quy về trung bình hoặc phát hiện các thời điểm biến động cao 💥.
🌟 **Cách hoạt động của Chỉ báo** 🌟
1. **Tính toán Trung bình và Độ lệch**:
- Một số lượng thanh (hoặc khoảng thời gian) trước đó được phân tích để tính giá đóng cửa trung bình và độ lệch chuẩn của nó. 🧮
- Với các giá trị này, xác định mức độ giá hiện tại lệch khỏi trung bình. Sự khác biệt này được biểu thị dưới dạng Z-Score.
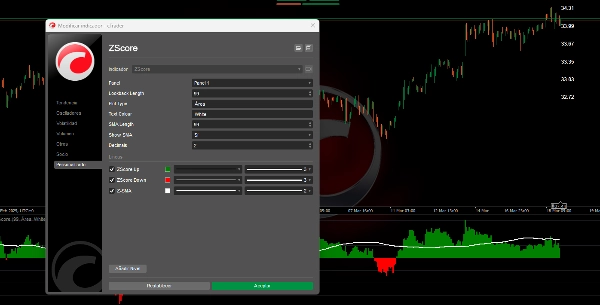
2. **Hiển thị Z-Score**:
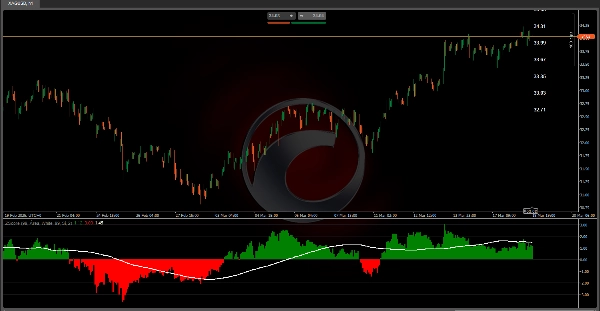
- **Chế độ Khu vực**: Hai biểu đồ cột được hiển thị: một màu xanh lá 🟩 cho các giá trị dương (khi giá trên trung bình) và một màu đỏ 🔴 cho các giá trị âm (khi giá dưới trung bình). Điều này giúp bạn dễ dàng nhận biết cường độ và hướng lệch.
3. **Trung bình Động của Z-Score**:
- Một trung bình động được tính trên các giá trị Z-Score. Điều này giúp làm mượt các biến động và xác định xu hướng trong cách lệch giá diễn ra theo thời gian. 📊
4. **Vùng Xác suất và Nhãn Tham chiếu**:
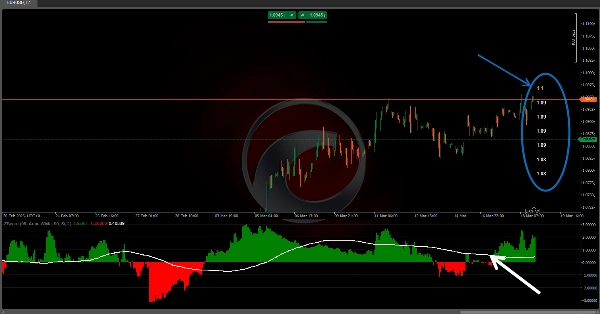
- Ngoài ra, các nhãn được đặt trên biểu đồ hiển thị các mức giá tương ứng với trung bình và từng mức độ lệch. Điều này hữu ích để hiểu, theo giá, mức độ "cực đoan" của thị trường. ⚠️
---
🌟 **Diễn giải và Ứng dụng cho Nhà giao dịch** 🌟
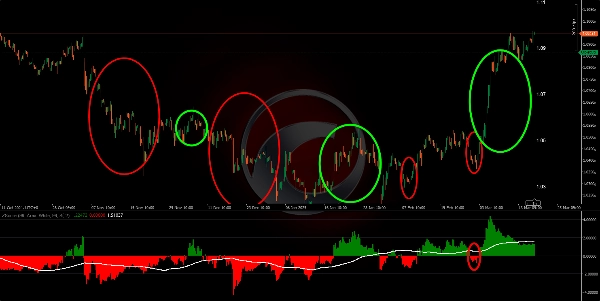
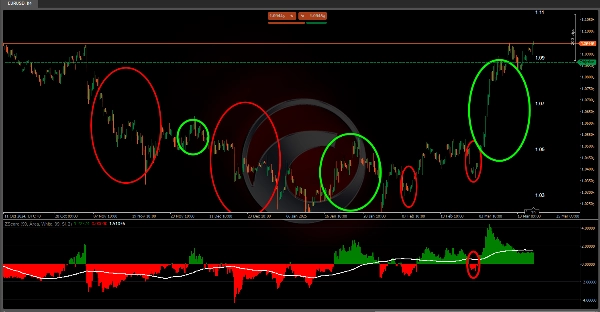
• **Phát hiện các điểm cực đoan**: Bằng cách quan sát các giá trị rất cao hoặc rất thấp trong chỉ báo, nhà giao dịch có thể nhận biết rằng giá đã di chuyển xa so với trung bình. Điều này có thể gợi ý một sự điều chỉnh sắp tới (nếu kỳ vọng hồi quy về trung bình) 🔄 hoặc một đột phá mạnh đang diễn ra.
• **Xác nhận xu hướng**: Trung bình động của Z-Score và các dải liên quan giúp bạn thấy được sự thay đổi trong xu hướng hành vi giá so với trung bình. Việc giao cắt hoặc thay đổi các đường này có thể được hiểu như tín hiệu vào 🛡️ hoặc ra khỏi thị trường.
• **Quản lý rủi ro**: Bằng cách biết các mức độ lệch và vùng xác suất, bạn có thể điều chỉnh kích thước vị thế hoặc xác định điểm dừng lỗ ⬇️ và chốt lời ⬆️, vì bạn có một tham chiếu cho các chuyển động bình thường so với cực đoan.
• **Hiểu biết thống kê về thị trường**: Ngoài việc chỉ là một công cụ đồ họa, chỉ báo này khuyến khích suy nghĩ về hành vi thị trường theo các thuật ngữ xác suất. Biết được mức "bình thường" của một chuyển động có thể là yếu tố quyết định khi đánh giá cơ hội giao dịch. 🎯
🌟 **Kết luận** 🌟
Thuật toán này chuyển đổi dữ liệu giá thành một biểu diễn thống kê giúp hình dung và định lượng sự lệch giá so với hành vi gần đây. Bằng cách kết hợp Z-Score, trung bình động, các dải lệch và bảng xác suất, chỉ báo cung cấp nhiều lớp thông tin. Điều này làm cho nó đặc biệt có giá trị trong việc xác định các thời điểm thị trường ở trạng thái bất thường, hỗ trợ quyết định vào 🚀, ra 🛑 và quản lý rủi ro dựa trên xác suất và thống kê. 📈📉
Chỉ báo Ctrader Store:
Phiên Chênh lệch Giá Trị Công bằng
Cấu trúc Thị trường Động
Phân tích Điểm Quay
Fibonacci Tuyến tính
Hồi quy Đa khung thời gian
Chênh lệch Giá Trị Công bằng Động lực
Định hướng Nến Đa cấp
Theo dõi
Đường Hỗ trợ và
Kháng cự Xu hướng Tự động
Tóm tắt
Đánh giá của khách hàng
5 | 100 % | |
4 | 0 % | |
3 | 0 % | |
2 | 0 % | |
1 | 0 % |


![Logo "[Stellar Strategies] Market Session Ultimate"](https://cdn.ctrader.com/image/webp/61ffd537-0125-4246-9e72-42eca1791d64_28232)


