KasePeakOscillator
مؤشر
45 التنزيلات
الإصدار 1.0، May 2026
Windows, Mac
5.0
التقييمات: 1
Trading product for KasePeakOscillator مؤشر Key Levels Volume, image 2
Trading product for KasePeakOscillator مؤشر Key Levels Volume, image 3
Trading product for KasePeakOscillator مؤشر Key Levels Volume, image 4
منذ 21/02/2025
466.3M
حجم التداول
180.83K
الربح بالبيب
22
المبيعات
6.87K
التثبيتات المجانية

الوصف

الKasePeakOscillator (KPO) هو أداة تحليل فني متقدمة مصممة لتحديد استنفاد السوق، وانعكاسات الاتجاه، وتحولات الزخم. على عكس المذبذبات القياسية، يدمج KPO مقاييس التقلب الإحصائية لتوفير إشارات أكثر موثوقية في ظروف السوق المتغيرة.

كيف يعمل: يقوم المؤشر بحساب العلاقة بين حركة السعر والتقلب التاريخي (متوسط النطاق اليومي/الانحراف المعياري). يقيم "الدورات القصيرة" مقابل "الدورات الطويلة" لتحديد ما إذا كانت حركة السعر ذات دلالة إحصائية أو مجرد ضوضاء في السوق. النتيجة هي مذبذب سلس ومستجيب يتأرجح حول خط الصفر.

المكونات الرئيسية:

  • الهيستوجرام (KCD): يمثل الزخم الأساسي. يشير عبور خط الصفر إلى تغير في انحياز الاتجاه قصير الأجل.
  • الأشرطة الديناميكية (العليا/الوسطى): تعمل كعتبات إحصائية لـ "الشراء المفرط" و"البيع المفرط". تتكيف مع تقلبات السوق، وتتوسع خلال فترات النشاط العالي وتتقلص خلال فترات التوحيد.
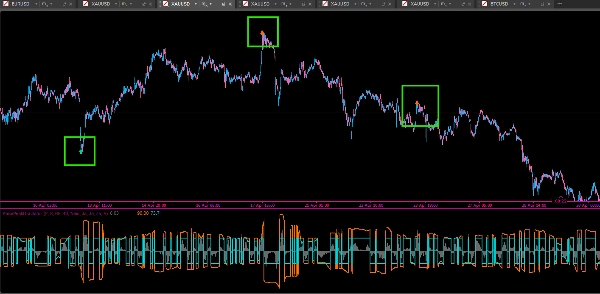
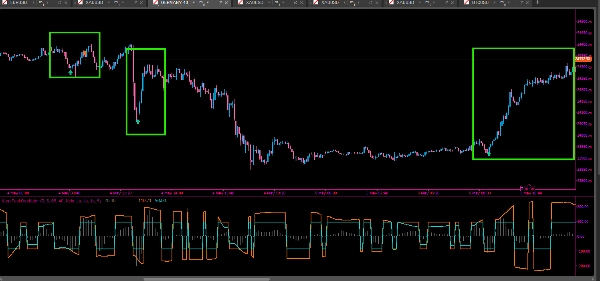
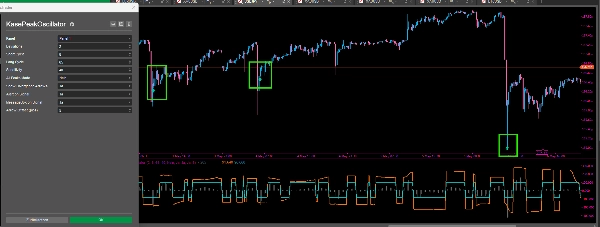
  • الكشف التلقائي عن القمم: يحدد المؤشر "القمم" و"القيعان" حيث يصل الزخم إلى أقصى حد إحصائي، مما يشير إلى احتمال الاستنفاد.

استراتيجية التداول:

  1. استنفاد القمة: عندما تحدث قمة زخم خارج الأشرطة الديناميكية (المشار إليها بأسهم النعناع أو البرتقالية)، فهذا يشير إلى أن الاتجاه الحالي مفرط وأن الانعكاس أو التصحيح محتمل.
  2. إشارات التباعد: يحدد KPO تلقائيًا التباعدات الصاعدة والهابطة. يحدث التباعد عندما يصنع السعر قمة جديدة لكن المذبذب لا يفعل ذلك، مما يشير إلى ضعف الزخم. يتم تمييز هذه الرموز بـ الأزرق الفاتح (صاعد) والذهبي (هابط).
  3. تأكيد الاتجاه: استخدم موقع الهيستوجرام بالنسبة لخط الصفر لتأكيد اتجاه الاتجاه. البقاء فوق الصفر يدعم المراكز الطويلة، بينما البقاء تحت الصفر يدعم المراكز القصيرة.

الميزات:

  • نظام تنبيه مدمج (صوت، صندوق رسالة، وأيقونات بصرية).
  • حساسية قابلة للتعديل لتتناسب مع فئات الأصول المختلفة (الفوركس، المؤشرات، العملات الرقمية).
  • "وضع جميع القمم" للتداول العدواني أو الوضع المصفى لإعدادات التأرجح عالية الاحتمالية.

الملخص

ملخص الذكاء الاصطناعي
The KasePeakOscillator (KPO) is a technical indicator designed to detect market exhaustion, trend reversals, and momentum shifts by integrating price action with statistical volatility measures. It calculates the relationship between short-term and long-term price cycles adjusted for historical volatility, producing a smooth oscillator around a zero line.
Key components include:
- Histogram (KCD): Represents core momentum; zero-line crossings indicate short-term trend changes.
- Dynamic Bands: Volatility-adjusted thresholds signaling overbought or oversold conditions.
- Automated Peak Detection: Identifies momentum extremes signaling potential trend exhaustion.
The KPO provides automated alerts for peak exhaustion and divergence signals, marking bullish and bearish divergences when price and momentum disagree. Trend direction can be confirmed by the histogram’s position relative to zero.
Features include adjustable sensitivity for various asset classes such as Forex, indices, and cryptocurrencies, an integrated alert system (sound, message, visual icons), and modes tailored for scalping or swing trading. The indicator supports analysis based on price bars and outputs reversal and divergence signals to assist in trading decisions.
ملف تعريف المؤشر
فئة المؤشر
الزخم
نوع المخرجات
الإشارات
متطلبات البيانات
أعمدة السعر فقط
الإشارات المدعومة
الانعكاس
التباين

تقييمات العملاء

5.0
التقييمات: 1
5
100 %
4
0 %
3
0 %
2
0 %
1
0 %
تقييمات العملاء
May 27, 2026
Reliable tool with a learning curve This indicator takes a little time to get used to, but once you understand how to read the signals properly it delivers solid results. Works best when combined with support and resistance levels and a clear market structure.

مناقشة

الأسئلة الشائعة

Key Levels
Volume
يتم توفير المنتجات المتاحة من خلال cTrader Store، بما في ذلك روبوتات التداول والمؤشرات والإضافات، من قبل مطوري الطرف الثالث وإتاحتها لأغراض الوصول المعلوماتي والفني فقط. cTrader Store ليس وسيطًا ولا يقدم نصائح استثمارية أو توصيات شخصية أو أي ضمان للأداء المستقبلي.

المزيد من هذا المؤلف

مؤشر
RSI
Forex
+4
High-probability trading signals in the fast-paced world of forex and CFD trading.
مؤشر
Prop
Stocks
+4
High-Performance Renko Chart Indicator with Advanced filtering method - built for Renko and candlestick charts.
مؤشر
ATR
MSS
+5
Detects ICT Turtle Soup setups — liquidity sweeps with MSS confirmation, ATR filter & kill zone session filter.
مؤشر
EMA
RSI
+2
Advanced TDI indicator with Shark Fin signals, chart arrows, MTF RSI, divergence detection and smart alerts.
مؤشر
Fibonacci
Key Levels
DailyTargets: Dynamic ADR-based levels & targets. Includes Buy/Sell zones, previous Hi/Lo, and automated trend alerts.
مؤشر
SMC
Prop
+15
Automatic Elliott Wave Detection with Professional Filters
مؤشر
Key Levels
Order Block
+3
Marks NY session range, detects wick sweeps beyond box edges.. One signal per day. Overlay, no repainting!
cBot
EMA
SL Manager
+5
Fully automated dual-symbol hedging cBot for cTrader.
20.6%
العائد على الاستثمار
8.66
عامل الربح
مؤشر
Key Levels
Supertrend
+3
Marks London and New York session opening zones and alerts you instantly on breakouts.
مؤشر
MACD
Key Levels
+2
Trend indicator with multi-timeframe filters, generating signals only on fully completed bricks & candles. No Repaint.
مؤشر
BOS
Fair Value Gap
+1
ICT Quarterly Theory indicator — color-coded Q1–Q4 session zones with smart entry signals and real-time alerts.
cBot
RSI
Aggressive
automates entries based on the RSX indicator — a smoothed, low-lag variant of the classic RSI.
1.67
عامل الربح

قد يعجبك أيضًا

مؤشر
Forex
Identify 34 candlestick patterns, track trends across timeframes, and get instant alerts with this powerful trading tool
مؤشر
cTreder Smart SMA
مؤشر
Prop
VWAP
+5
Multi-anchor VWAP indicator for cTrader. Plots two VWAP lines (red and blue) with selectable anchors.
مؤشر
Prop
E7 BBKG indicator with 80% plus accuracy used to show both, possible reversal and trend.
مؤشر
Forex
Indices
+5
Market Profile TPO for cTrader — full auction logic, IB, POC, VA zones, histogram and O/X markers with time
مؤشر
ATR
SMC
+19
Smart Liquidity Sweep detector with auto-drawing True Channels and real market structure mapping.
مؤشر
RSI
MACD
+2
Identify potential reversal points in the market by detecting candles with exceptionally long upper or lower wicks
مؤشر
Forex
BTCUSD
+8
Bayesian theory** to forecast a future price while providing **uncertainty ranges** that represent upper and lower bound
مؤشر
BOS
MSS
+3
Orderblocks with Multi-Timeframe.
مؤشر
BOS
CHOCH
+1
Maps unmitigated SMC swing points. Draws infinite structure lines until price touches them, labeling BOS & CHoCH breaks.
مؤشر
SMC
Prop
+13
Perfect for traders who demand a clear overview of multiple timeframes at a glance.
مؤشر
Prop
VWAP
+12
Visualize trading volume by price within any range, highlight POC and key value areas.
مؤشر
ATR
Upgrade to ATR-RMA! Experience the precise ATR using Relative Moving Average for accurate volatility analysis in cTrader
مؤشر
News Filter
External Data
+3
Real-time financial news and economic calendar overlay for cTrader with smart alerts
مؤشر
VWAP
Volume
+2
VWAP Stdev Heatmap: Advanced daily VWAP with 5-tier standard deviation bands and dynamic candlestick coloring.
مؤشر
ATR
SMC
+18
Precision SMC tool with HTF sweeps, MSS confirmation & smart FVG detection for high-probability reversals.
مؤشر
RSI
Signal
+2
Dynamic circles visualize price's volatility position. Like RSI for market overextension & stretch. Quantify context.
مؤشر
MACD
Forecast future prices using historical MACD trends. Features a probability fan for smart entries and dynamic targets.

السعر

منذ 21/02/2025
466.3M
حجم التداول
180.83K
الربح بالبيب
22
المبيعات
6.87K
التثبيتات المجانية