
Description
✅ UATKit is provided free of charge as a goodwill contribution to the cTrader community, created by a professional trader who understands the day‑to‑day challenges of chart analysis and execution.
⚠️Please check the product page periodically for updates, as cTrader does not notify users when new versions of indicators are released.
⭐️ I would also be happy to receive your comments and feedback in the Customer Reviews and Discussion sections.
1. What This Product Is
A comprehensive workflow‑enhancement toolkit designed to make charting on cTrader smoother, clearer, and more efficient.
Universal Assistant Toolkit (UATKit) is a multi‑feature chart‑side companion for cTrader.
It brings together several practical tools - each designed to solve a specific workflow need - into one unified, lightweight indicator.
Every feature in UATKit is fully customizable and operates independently, giving traders complete control to adjust behavior, visuals, and hotkeys while enabling only the tools they need for a clean, responsive charting experience.
UATKit is provided free of charge as a goodwill contribution to the cTrader community, created by a professional trader who understands the day‑to‑day challenges of chart analysis and execution.
2. Who This Toolkit Is For
UATKit is built for traders who:
- Spend significant time analyzing charts
- Prefer clean, informative, and customizable chart layouts
- Want faster access to common actions through hotkeys
- Need visual clarity during fast‑moving markets
- Appreciate tools that enhance workflow without adding noise
Whether you scalp, swing trade, or simply want a more organized charting environment, UATKit adapts to your style.
3. Feature Groups Overview
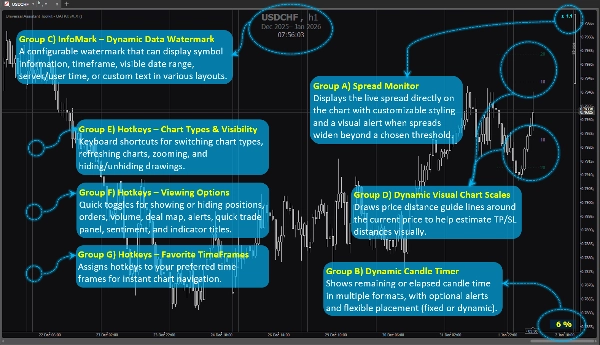
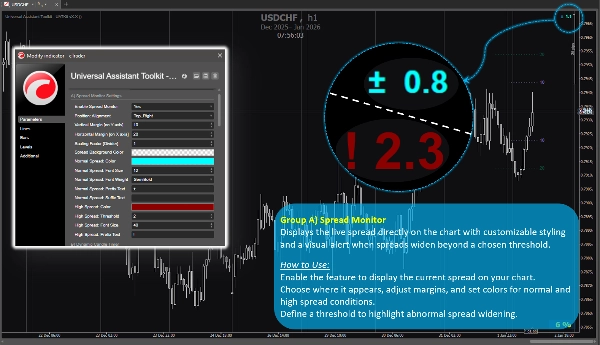
Feature Group A) 🔸 Spread Monitor
Displays the live spread directly on the chart with customizable styling and a visual alert when spreads widen beyond a chosen threshold.
How to Use:
Enable the feature to display the current spread on your chart.
Choose where it appears, adjust margins, and set colors for normal and high‑spread conditions.
Define a threshold to highlight abnormal spread widening.
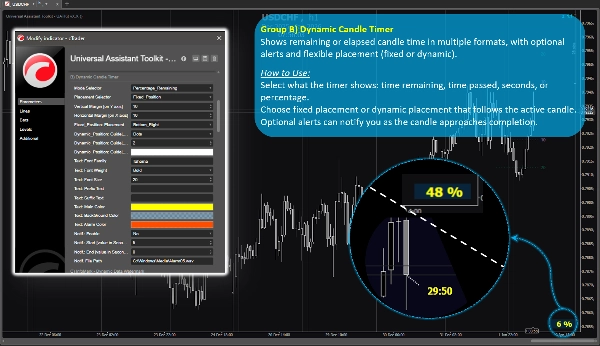
Feature Group B) 🔸 Dynamic Candle Timer
Shows remaining or elapsed candle time in multiple formats, with optional alerts and flexible placement (fixed or dynamic).
How to Use:
Select what the timer shows: time remaining, time passed, seconds, or percentage.
Choose fixed placement or dynamic placement that follows the active candle.
Optional alerts can notify you as the candle approaches completion.
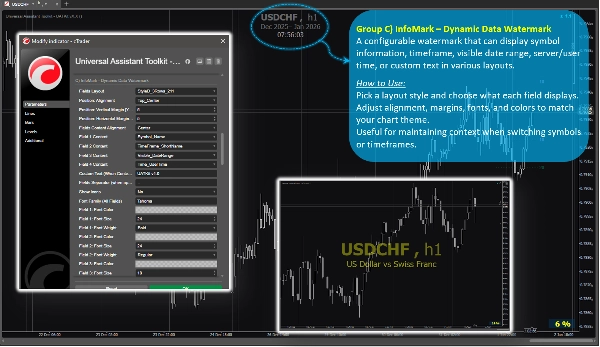
Feature Group C) 🔸 InfoMark – Dynamic Data Watermark
A configurable watermark that can display symbol information, timeframe, visible date range, server/user time, or custom text in various layouts.
How to Use:
Pick a layout style and choose what each field displays.
Adjust alignment, margins, fonts, and colors to match your chart theme.
Useful for maintaining context when switching symbols or timeframes.
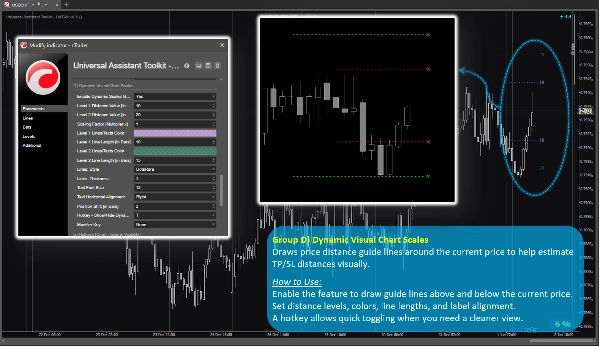
Feature Group D) 🔸 Dynamic Visual Chart Scales
Draws price‑distance guide lines around the current price to help estimate TP/SL distances visually.
How to Use:
Enable the feature to draw guide lines above and below the current price.
Set distance levels, colors, line lengths, and label alignment.
A hotkey allows quick toggling when you need a cleaner view.
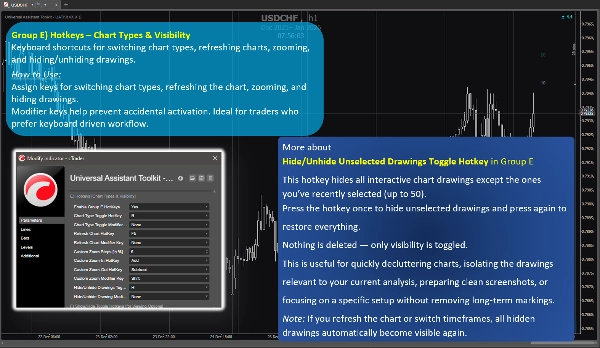
Feature Group E) 🔸 Hotkeys – Chart Types & Visibility
Keyboard shortcuts for switching chart types, refreshing charts, zooming, and hiding/unhiding drawings.
How to Use:
Assign keys for switching chart types, refreshing the chart, zooming, and hiding drawings.
Modifier keys help prevent accidental activation. Ideal for traders who prefer keyboard‑driven workflow.
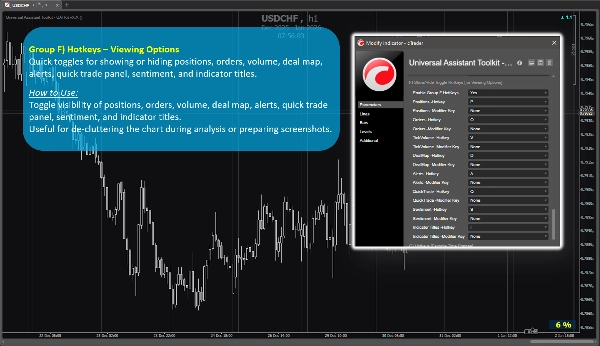
Feature Group F) 🔸 Hotkeys – Viewing Options
Quick toggles for showing or hiding positions, orders, volume, deal map, alerts, quick trade panel, sentiment, and indicator titles.
How to Use:
Toggle visibility of positions, orders, volume, deal map, alerts, quick trade panel, sentiment, and indicator titles.
Useful for de-cluttering the chart during analysis or preparing screenshots.
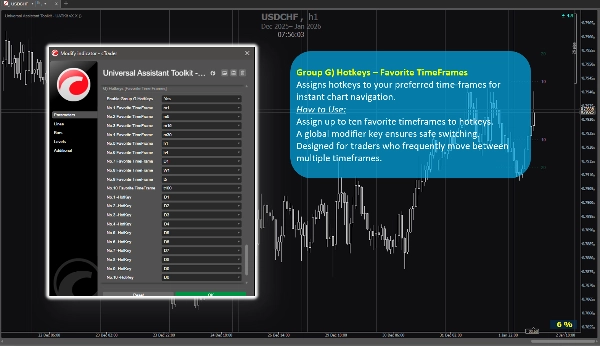
Feature Group G) 🔸 Hotkeys – Favorite TimeFrames
Assigns hotkeys to your preferred time-frames for instant chart navigation.
How to Use:
Assign up to ten favorite timeframes to hotkeys.
A global modifier key ensures safe switching.
Designed for traders who frequently move between multiple timeframes.
4. Additional Notes for Users
- All features are optional and can be enabled or disabled individually.
- The toolkit is optimized for performance and designed to avoid interfering with other indicators.
- Most parameters include built‑in tooltips. Simply hover over any setting to view extra guidance and usage notes.
- No external data sources are used; all information comes from the chart and platform.
- This toolkit is provided free to support the cTrader community and improve everyday charting workflows.
- Default settings are sensible, so users who don’t need special configurations can rely on the preset parameters without spending extra time on setup.
- ⭐️ Feedback and suggestions are welcome to help refine future versions (use discussion section on this page).
- ⚠️Please check the product page periodically for updates, as cTrader does not notify users when new versions of indicators are released.
Summary
Key features include:
- **Spread Monitor:** Displays live spread on the chart with customizable visuals and alerts for spread widening.
- **Dynamic Candle Timer:** Shows remaining or elapsed candle time in various formats, with optional alerts and flexible positioning.
- **InfoMark Watermark:** Configurable watermark displaying symbol info, timeframe, date range, server/user time, or custom text.
- **Dynamic Visual Chart Scales:** Price-distance guide lines around current price to estimate take-profit/stop-loss distances visually.
- **Hotkeys for Chart Types & Visibility:** Keyboard shortcuts for switching chart types, refreshing, zooming, and toggling drawing visibility.
- **Hotkeys for Viewing Options:** Quick toggles for positions, orders, volume, deal map, alerts, quick trade panel, sentiment, and indicator titles.
- **Hotkeys for Favorite TimeFrames:** Assign up to ten favorite timeframes to hotkeys for instant navigation.
All features are optional and configurable, optimized for performance without interfering with other indicators. UATKit supports various markets including Forex, indices, commodities, crypto, and stocks. It is intended for traders who seek a clean, customizable, and efficient charting environment with enhanced workflow controls.
Customer reviews
5 | 100 % | |
4 | 0 % | |
3 | 0 % | |
2 | 0 % | |
1 | 0 % |


!["[Hamster-Coder] Pivot Points MTF" logo](https://cdn.ctrader.com/image/webp/4c143e5a-309c-40e3-a578-f04d1e133ffa_31159)


