present
Registrati e ricevi uno sconto da $50 sul tuo primo acquisto
Trading product for IR Close MTF Indicatore, image 1
IR Close MTF
5.0
Recensioni: 1
5.64K
Installazioni gratuite

Descrizione

questo indicatore mostra la chiusura di un altro intervallo di tempo in un intervallo di tempo inferiore. per esempio: mostra la chiusura giornaliera in m 15.


Riepilogo

Riepilogo AI
IR Close MTF is a trading indicator designed to display the closing price of a higher time frame on a lower time frame chart. For example, it can show the daily close price while viewing a 15-minute chart. This functionality allows traders to easily reference key price levels from different time frames within a single chart, aiding in multi-time frame analysis. The indicator supports various time frame combinations, enhancing situational awareness without switching charts.
Profilo indicatore

Discussioni

Recensioni dei clienti

5.0
Recensioni: 1
5
100 %
4
0 %
3
0 %
2
0 %
1
0 %
Recensioni dei clienti
September 30, 2025

Domande frequenti

I prodotti disponibili tramite cTrader Store, inclusi bot di trading, indicatori e plugin, sono forniti da sviluppatori terzi e resi disponibili esclusivamente a scopo informativo e di accesso tecnico. cTrader Store non è un broker e non fornisce consulenze in materia di investimento, raccomandazioni individualizzate o garanzie di risultati futuri.

Altro da questo autore

with this indicator you could see other time frame candle in your chart.
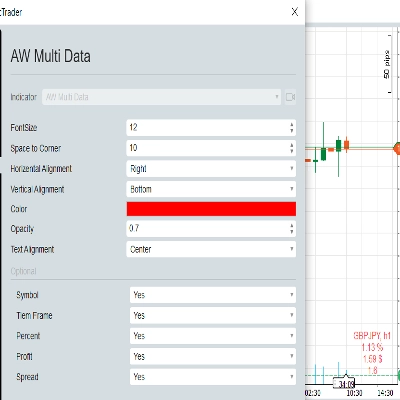
show spread on chart
some user add moving average to macd to see better. in ctrader 4.3.11 there is a problem with this . I make a macd tha
this indicator show macd on chart.
Multi Time Frame Moving Average is a powerful and flexible indicator for cTrader
 this moving include everything that a trader needs from Moving Average.
this indicaotr show distance between Tenkan to Kijun, Close to Kijun and Close to Tenkan 
Add Slowing to IR Moving Average.
IR Candle Open plots customizable opening price lines for daily, weekly, and monthly candles
Coral indicator
you could put your check list in your chart you could split your test with “,” you could put your checklist in indicat
don't move to the end of chart after timeframe changing. it should be better to use for near history. for long history

Potrebbe interessarti anche

Market structure with BOS and CHoCH, order blocks, and retest buy/sell arrows with entry, stop and two targets
Turn WaveTrend Cross into a BTC profit machine precise buy sell signals, smart momentum edge, no lag trading system
TSPivotSMC-V2: The Fusion of Classical Pivots & Institutional Liquidity.
Advanced indicator to highlight key execution context and help aligning structure, location, and risk.
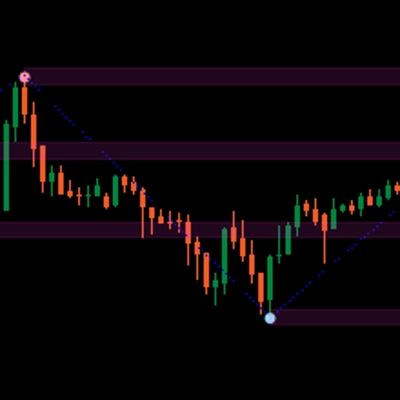
Automatic ZigZag swings with dynamic support & resistance levels, labeling highs/lows for clear trend signals.
AI-powered daily range forecasts help traders spot volatility opportunities and plan stops and targets.
Automatic Support/Resistance zones from swing points.
Trend-filtered signals, transparent trade plans and a multi-timeframe decision panel for cTrader.
Master trends with Smart ADX: MTF Scanner, precise Buy/Sell signals, Divergence & clear Exit targets 🎯
Super Trend Rsi ,ATR + trend change distance + dynamic Alpha, divergence/convergence
ICT Quarterly Theory indicator — color-coded Q1–Q4 session zones with smart entry signals and real-time alerts.
This trading game allows you to explore and practice investment strategies in a real-time market data environment.
Multi VWAP. Three timeframes. One clean chart. Your Essential Trading Tool.
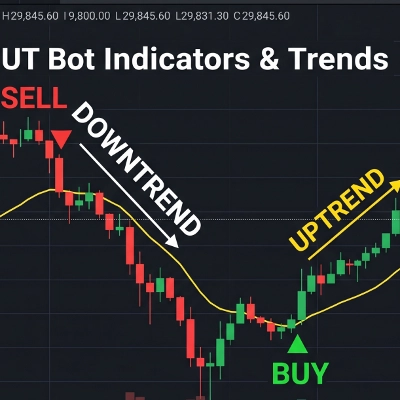
The UT Bot identify potential trend reversals and momentum shifts.
Next-gen Volume Oscillator using Hyperbolic Tangent math. No repainting. Includes arrows, alerts, and overlay mode 🎯
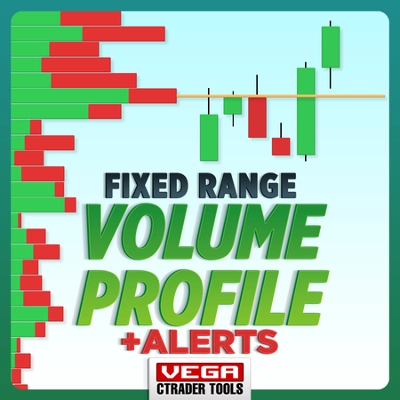
Identify key support and resistance levels through detailed volume distribution analysis.
Adaptive MA anchored to structural trend changes — no fixed period. Dual Supertrend + swing detection.
Smart momentum tool uses advanced filtering and colour cues for clearer market direction and trading signals.

Prezzo

5.64K
Installazioni gratuite