Descrizione
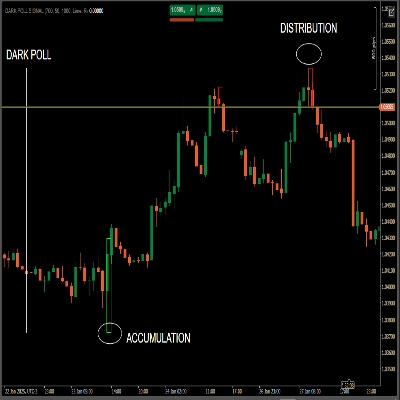
Identifica le zone di ALTO INTERESSE ISTITUZIONALE: Dove c'è MAGGIORE VOLUME nelle rotture, c'è MAGGIORE PARTECIPAZIONE da PARTE DEI GRANDI OPERATORI.
• ⚖️ Misura l'EQUILIBRIO DEL POTERE: Verifica se LA PRESSIONE DI ACQUISTO o DI VENDITA predomina in ogni zona di prezzo
• 🎯 Individua i LIVELLI CHIAVE: Zone con MAGGIORE VOLUME DI ROTTURA spesso fungono da SUPPORTO/RESISTENZA FUTURI
• ✅ Conferma i movimenti: Una ROTTURA con ALTO VOLUME ha una MAGGIORE PROBABILITÀ di essere genuina
https://chartshots.spotware.com/c/6941a3f65f376
📈 COME LEGGERE?
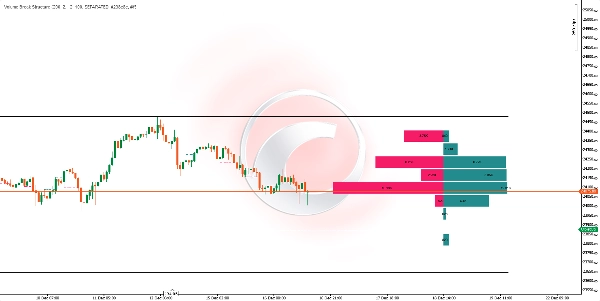
📊 Le Linee Orizzontali
• Ogni linea segna un livello dove si è verificata una ROTTURA DI STRUTTURA
• 🟢 Rottura RIALZISTA
• 🔴 Rottura RIBASSISTA
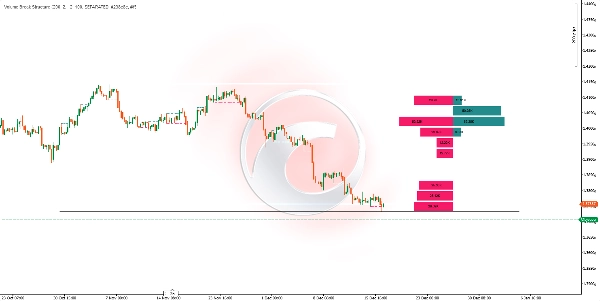
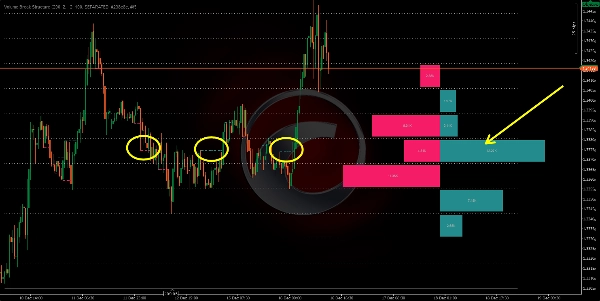
📈 L'Istogramma
• Posizionato sul LATO DESTRO DEL GRAFICO
• Diviso in RIGHE che rappresentano INTERVALLI DI PREZZO UGUALI
• 📗 Barre di PRESSIONE ACQUISTO: VOLUME ACCUMULATO di rotture rialziste in quella zona
• 📕 Barre di PRESSIONE VENDITA: VOLUME ACCUMULATO di rotture ribassiste in quella zona
• ⬆️ Dimensione della barra: Dimensione MAGGIORE indica VOLUME MAGGIORE di rotture a quel livello
https://chartshots.spotware.com/c/6941a4346ede0
🟦 La Griglia
• Le linee PIENE superiore e inferiore segnano il RANGO MASSIMO e MINIMO del periodo analizzato
• Le linee PUNTINATE dividono quel range in SEZIONI UGUALI per una lettura più semplice
⚙️ 🔧 PARAMETRI PRINCIPALI
ParametroFunzione
🕯️ Barre di Calcolo
Numero di candele che analizza ALL'INDIETRO
🎚️ Lunghezza dello Swing
SENSIBILITÀ per rilevare i pivot (MAGGIORE = meno segnali, PIÙ AFFIDABILE)
📊 Righe dell'Istogramma
Numero di DIVISIONI/RIGHE nell'istogramma
📏 Larghezza dell'Istogramma
LARGHEZZA VISIVA dell'istogramma
👁️ Modalità di Visualizzazione
SEPARATA (acquisto/vendita) o AGGREGATA (volume totale)
🔄 QUANDO SI AGGIORNA?
🕒 L'indicatore SI RICALCOLA AUTOMATICAMENTE alla CHIUSURA di ogni candela, incorporando ogni NUOVA ROTTURA DI STRUTTURA avvenuta.
💡 🤝 COME ABBINARLO?
📈 Con l'ANALISI DEL TREND
• In un TREND RIALZISTA, cerca zone dove IL VOLUME DELLA PRESSIONE DI ACQUISTO DOMINA per potenziali ingressi sui RITRACCIAMENTI
• In un TREND RIBASSISTA, cerca zone dove IL VOLUME DELLA PRESSIONE DI VENDITA DOMINA per potenziali ingressi sui RIMBALZI
🛡️ Con SUPPORTO e RESISTENZA
• I livelli con il MAGGIORE VOLUME DI ROTTURA spesso diventano ZONE DI REAZIONE FUTURE
• Usa l'istogramma per identificare le zone più "DIFESE" da acquirenti o venditori
🌊 Con il FLUSSO ORDINI
• CONFERMA le letture dell'istogramma con strumenti di FLUSSO ORDINI IN TEMPO REALE
• Le zone con alto volume di rottura spesso coincidono con AREE DI ASSORBIMENTO ISTITUZIONALE
🕯️ Con l'AZIONE DEL PREZZO
• Cerca PATTERN DI CANDLESTICK nelle zone dove l'istogramma mostra SBILANCI SIGNIFICATIVI
• Un PATTERN DI RINVERSAMENTO in una zona di ALTA PRESSIONE DI ACQUISTO ha una MAGGIORE PROBABILITÀ DI SUCCESSO
🎯 🚀 INTERPRETAZIONE RAPIDA
Segnale VisivoInterpretazione
📗 Grande barra ACQUIRENTE, 📕 piccola barra venditore
ZONA DI FORTE DOMANDA, possibile SUPPORTO
📕 Grande barra VENDITORE, 📗 piccola barra acquirente
ZONA DI FORNITURA FORTE, possibile RESISTENZA
⚔️ Entrambe le barre GRANDI e simili
ZONA DI BATTAGLIA, ALTA VOLATILITÀ prevista
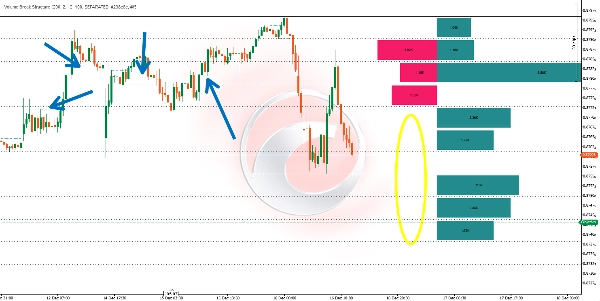
⏭️ Riga senza BARRE
ZONA DI SCARSO INTERESSE, il prezzo è passato VELOCE
CONSIDERAZIONI IMPORTANTI
• ❌ L'indicatore FUNZIONA CON DATI STORICI CONFERMATI; NON PREVEDE IL FUTURO
• 📊 MAGGIORE numero di barre di calcolo = VISIONE PIÙ AMPIA ma può DILUIRE I SEGNALI RECENTI
• ⏰ ADATTA la Lunghezza dello Swing in base al TIMEFRAME: VALORI PIÙ ALTI per TIMEFRAME PIÙ ALTI
• 🛡️ COMBINA SEMPRE con UNA CORRETTA GESTIONE DEL RISCHIO
Riepilogo
Key features include:
- Horizontal lines marking bullish (green) and bearish (red) structure breaks.
- A histogram on the right side of the chart divided into rows representing equal price ranges, showing accumulated volume of bullish and bearish breaks. Larger bars indicate higher volume.
- A grid marking the maximum and minimum price range of the analyzed period, divided into equal sections for easier reading.
The indicator recalculates automatically at the close of each candle, updating with any new structure breaks. Main adjustable parameters include the number of bars analyzed backward, swing length sensitivity for pivot detection, histogram rows, histogram width, and display mode (separated buy/sell or aggregated volume).
Volume Break Structure can be combined with trend analysis, support and resistance levels, order flow tools, and price action patterns to confirm market movements and identify potential entry points. It works with confirmed historical data and does not predict future price action.
Recensioni dei clienti
5 | 0 % | |
4 | 100 % | |
3 | 0 % | |
2 | 0 % | |
1 | 0 % |