الوصف
🚀 أكثر من 10,000 متداول يستخدمون بالفعل مؤشراتنا TOP 🏆
اكتشف لماذا يختارنا المحترفون – أقوى الأدوات على cTrader (المؤشرات، الخوارزميات، وcBots) في انتظارك.
👉 احصل على جميع أنظمتنا TOP هنا:
📌 مؤشرات هيكل السوق
- ✅ هيكل السوق المتقدم: Bos, Choch, SwinLevels, Order Blocks, مكتشف هيكل السوق والسيولة
- 🔄 تحليل هيكل السوق الديناميكي لنقاط التحول
- 🧱 كتلة الأوامر
- ⚖️ اختلال السوق
- ⛓️ BOS & CHOCH
- 🧠 قوة ICT 3
- 🌀 مناطق قطبية السوق
🔚 أنظمة الخروج الذكية
📐 مؤشرات ZigZag
🧱 مؤشرات الدعم والمقاومة
📊 مؤشرات الاتجاه والقناة
- 🔄 قناة الاتجاه التلقائية
- 📊 سوبرتريند
- 🧠 قناة الاتجاه التكيفية
- 💥 نظام اختراق القناة
- 🌈 تدرج الاتجاه الديناميكي
- ⭐ قناة SSL المميزة
- 🔁 المتوسط المتحرك التفاعلي
💧 أدوات الحجم والسيولة
- 🔥 خريطة حرارة حجم POC
- 📉 خريطة تصفية الرافعة المالية
- 🔍 فجوة القيمة العادلة للزخم
- 🕒 جلسات فجوة القيمة العادلة
⚡ مؤشرات الزخم وRSI
🔮 أدوات التنبؤ والإسقاط
- 📐 التنبؤ بناءً على Linreg وATR
- 📏 انحدار خطي فيبوناتشي متعدد الأطر الزمنية
- 📈 عارض تدفق السوق المدعوم بالحجم
محلل اتجاه الزخم 🚀📊
خوارزمية تقنية متقدمة مصممة لتحديد اتجاه السوق وتقييم قوته، مندمجة مع عدة مقاييس تحليلية. يجمع هذا المؤشر بين المتوسطات المتحركة الأسية (EMAs)، معدل التغير (RoC)، التقلب، القوة النسبية، و الحجم لتقديم إشارات واضحة وقابلة للتنفيذ. أدناه، نشرح وظائفه والمنطق وراء حساباته.
المكونات الرئيسية 🔧
تم بناء الخوارزمية على خمسة عناصر أساسية تعمل بتناغم:
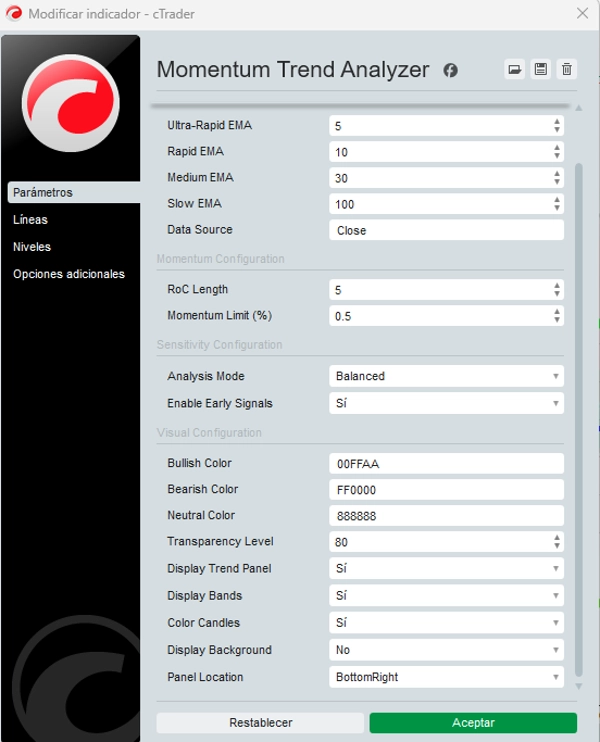
- المتوسطات المتحركة الأسية (EMA) 📈
-
- يستخدم أربعة EMAs بفترات مميزة: فائق السرعة، سريع، متوسط، وبطيء—عادةً ما تحسب على أسعار الإغلاق.
- تكتشف EMAs قصيرة الأجل (فائق السرعة والسريع) الحركات الفورية، بينما تعكس EMAs طويلة الأجل (المتوسط والبطيء) الاتجاهات المستمرة.
- معدل التغير (RoC) ⚡
-
- يقيس النسبة المئوية لتغير السعر على مدى فترة محددة، ويعمل كمؤشر مباشر للزخم.
- RoC مملس يصفّي التقلبات الطفيفة ويثبت الإشارة.
- النطاق الحقيقي المتوسط المُطَبَّع (ATR) 🌪️
-
- يقيس ATR التقلب التاريخي، ويُطَبَّع بقسمته على السعر الحالي للتقييم النسبي.
- ATR المُطَبَّع العالي يشير إلى زيادة التقلب، مما يؤثر على تفسير قوة الاتجاه.
- مؤشر القوة النسبية (RSI) 💪
-
- يقيس هذا المذبذب حجم وسرعة حركات السعر، ويحدد حالات الشراء المفرط/البيع المفرط.
- يساعد في تقييم شدة الزخم داخل الاتجاه.
- متوسط الحجم 🔊
-
- متوسط متحرك بسيط لحجم التداول يكشف عن فترات النشاط العالي، مما يعزز صحة الإشارة.
منطق الحساب 🧠
يقوم محلل اتجاه الزخم بتوليد إشارات الاتجاه والقوة من خلال مجموعة من الشروط والحسابات المحددة:
1. تحديد الاتجاه
- 🟢 اتجاه صاعد: يتأكد عندما يكون EMA السريع > EMA المتوسط، EMA المتوسط > EMA البطيء، وسعر الإغلاق > EMA السريع.
- 🔴 اتجاه هابط: يتأكد عندما يكون EMA السريع < EMA المتوسط، EMA المتوسط < EMA البطيء، وسعر الإغلاق < EMA السريع.
- ⚪ اتجاه محايد: يحدث عندما لا يتحقق أي من الشرطين، مما يشير إلى توحيد أو تردد.
2. إشارات الاتجاه المبكرة 🔍
- يكشف عن تحولات محتملة في الاتجاه قبل التأكيد الكامل باستخدام:
-
- EMA فائق السرعة
- ميل EMA السريع
- RoC المملس
- مثال: تُطلق إشارة صعودية مبكرة إذا عبر EMA فائق السرعة فوق EMA السريع، وكان ميل EMA السريع إيجابيًا، وتجاوز RoC المملس عتبة الزخم.
3. ضبط الحساسية ⚖️
ثلاثة أوضاع متاحة:
- 🛡️ محافظ: يعطي الأولوية للإشارات المؤكدة، مع تقليل الإيجابيات الكاذبة (كشف أبطأ).
- ⚔️ عدواني: يفضل الإشارات المبكرة للاستجابة الأسرع (مخاطرة أعلى).
- ⚖️ متوازن: نهج وسط.
4. حساب قوة الاتجاه 💯
تُستمد القوة من تكامل موزون لـ:
- فرق EMA: المسافة (%) بين EMAs السريع والبطيء.
- مساهمة RSI: الفرق بين RSI و50 (صعودي/هبوطي).
- التقلب (ATR المُطَبَّع): يضبط القوة بناءً على تقلبات السوق.
- الحجم النسبي: تزداد القوة إذا كان الحجم الحالي > المتوسط.
- الزخم (RoC المملس): يقيس سرعة الحركة.
- النتيجة: نسبة القوة (0%-100%)—القيم الأعلى = اتجاهات قوية.
5. الأشرطة الديناميكية 🎯
- ثلاثة أشرطة علوية/سفلية تعتمد على أعلى/أدنى أسعار حديثة.
- تعمل كـ مستويات دعم/مقاومة ديناميكية، تتكيف مع تقلبات السوق.
التطبيق العملي للمتداولين 💼
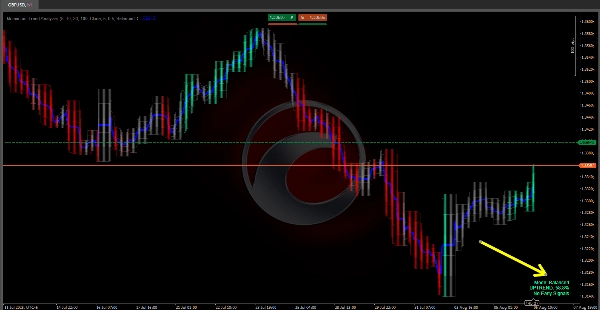
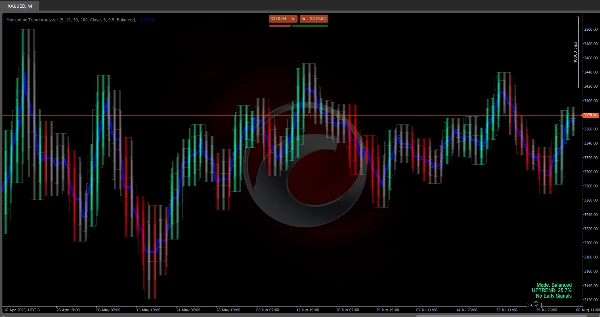
- 📊 التصور: يُعرض الاتجاه عبر تظليل ملون (🟢 صاعد، 🔴 هابط، ⚪ محايد) + خط الاتجاه.
- 💪 القوة: قيمة مئوية (مثلاً، 24.3% = حذر؛ >50% = ثقة عالية).
- 🔄 استراتيجية الأشرطة:
-
- صاعد: الشراء عند الأشرطة السفلية، والبيع عند الأشرطة العلوية.
- هابط: البيع عند الأشرطة العلوية، والتغطية عند الأشرطة السفلية.
- 🚨 إشارات مبكرة: تساعد المتداولين العدوانيين على توقع الأسواق سريعة الحركة.
- 🛠️ المرونة: أوضاع الحساسية تتكيف مع المحافظة (انتظار التأكيد) أو العدوانية (التصرف المبكر) بأساليب مختلفة.
الخلاصة 🎯
يوفر محلل اتجاه الزخم تحليلًا شاملاً للاتجاه والزخم من خلال دمج EMAs، RoC، ATR المُطَبَّع، RSI، والحجم. منطق حسابه—المبني على شروط واضحة وعوامل موزونة—يتكيف مع مستويات المخاطرة واستراتيجيات التداول المختلفة، مما يجعله أداة قوية للمتداولين..
الملخص
The indicator determines bullish, bearish, or neutral trends based on EMA relationships and price positioning. It provides early trend shift signals using ultra-fast EMA, fast EMA slope, and smoothed RoC. Users can select from three sensitivity modes—conservative, balanced, and aggressive—to adjust signal responsiveness according to their trading style.
Trend strength is calculated as a weighted integration of EMA spread, RSI deviation from neutral, normalized volatility, relative volume, and momentum, expressed as a percentage from 0% to 100%. The indicator also features dynamic bands derived from recent price highs and lows, serving as adaptive support and resistance levels.
Visualization includes colored shading to indicate trend direction and a trendline, with strength values aiding decision-making. The band strategy suggests buying near lower bands and selling near upper bands in bullish trends, and the reverse in bearish trends. This tool supports diverse risk levels and trading strategies by providing comprehensive trend and momentum analysis.