คำอธิบาย
🚀 เปลี่ยนแผนภูมิของคุณให้เป็นศูนย์กลางการตัดสินใจเชิงกลยุทธ์
Smart Tech Analysis ไม่ใช่แค่ตัวบ่งชี้เท่านั้น
มันคือแดชบอร์ดวิเคราะห์อัจฉริยะครบวงจร พัฒนาขึ้นสำหรับเทรดเดอร์ที่ต้องการความชัดเจน ความแม่นยำ และความคล่องตัวในการตัดสินใจ
ในขณะที่ตัวบ่งชี้ส่วนใหญ่ให้ข้อมูลแยกส่วนเท่านั้น Smart Tech Analysis ผสานรวม:
✔ แนวโน้ม
✔ ปริมาณ
✔ ฟีโบนักชี
✔ แนวรับและแนวต้าน
✔ สัญญาณทางเทคนิค
✔ คำแนะนำในการดำเนินงาน
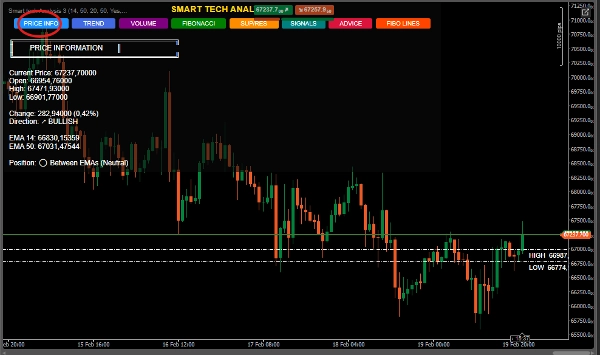
✔ ข้อมูลราคาละเอียด
ทั้งหมดในแดชบอร์ดแบบไดนามิกและโต้ตอบได้เพียงหนึ่งเดียว
🔥 ความแตกต่างที่สำคัญ
🎯 1. ระบบ 6-in-1 – การวิเคราะห์แบบบูรณาการ
คุณไม่จำเป็นต้องสลับไปมาระหว่างตัวบ่งชี้หลายตัวอีกต่อไป
Smart Tech Analysis รวม:
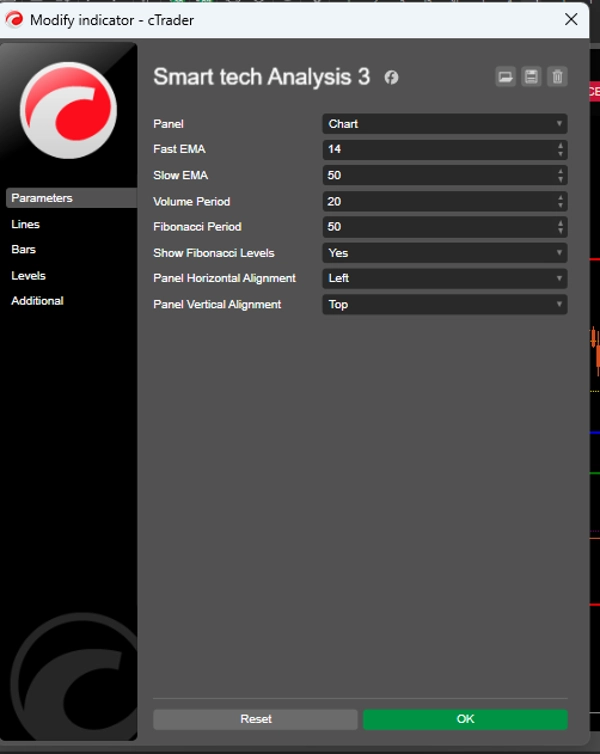
📈 EMA เร็วและช้า (14 และ 50)
📊 ปริมาณพร้อมการวิเคราะห์เปรียบเทียบ
🧩 ฟีโบนักชีอัตโนมัติ
🛡 แนวรับและแนวต้านแบบไดนามิก
🚦 การสร้างสัญญาณอัจฉริยะ
📌 คำแนะนำพร้อมจุดหยุดและเป้าหมายที่คำนวณได้
👉 สิ่งนี้ช่วยลดเสียงรบกวนทางสายตาและเพิ่มความเป็นวัตถุประสงค์
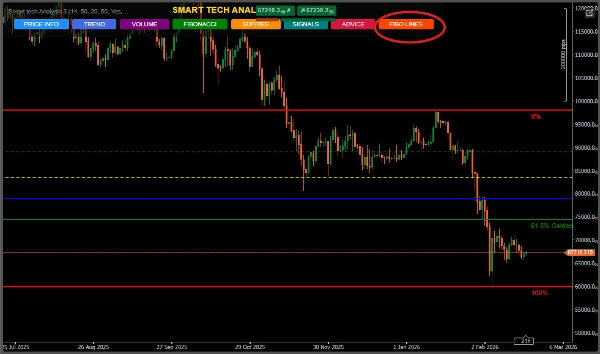
🧠 2. แผงโต้ตอบพิเศษ
อินเทอร์เฟซมืออาชีพพร้อมปุ่มอัจฉริยะ:
ข้อมูลราคา
แนวโน้ม
ปริมาณ
ฟีโบนักชี
แนวรับ/แนวต้าน
สัญญาณ
คำแนะนำ
เทรดเดอร์เลือกได้อย่างแม่นยำว่าต้องการเห็นอะไร
📌 การจัดระเบียบ
📌 การควบคุม
📌 ความเป็นมืออาชีพ
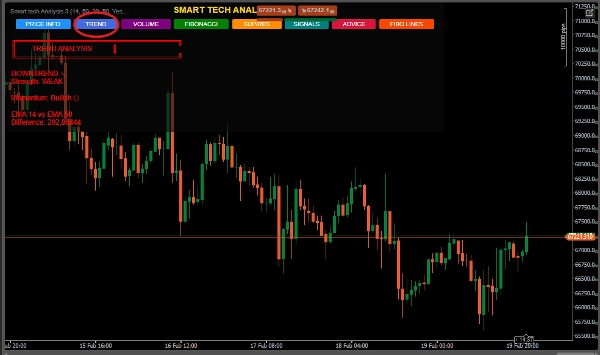
📈 3. การวิเคราะห์แนวโน้มด้วยความแข็งแกร่งและโมเมนตัม
มันไม่ได้แค่แสดงว่ากำลังขึ้นหรือลง
มันคำนวณ:
ความเข้มข้นของแนวโน้ม
เปอร์เซ็นต์ความแข็งแกร่งระหว่าง EMA
การจัดประเภท: อ่อน, ปานกลาง หรือ แข็งแกร่ง
สิ่งนี้ช่วยหลีกเลี่ยงการเข้าซื้อที่อ่อนในตลาดที่เคลื่อนไหวด้านข้าง
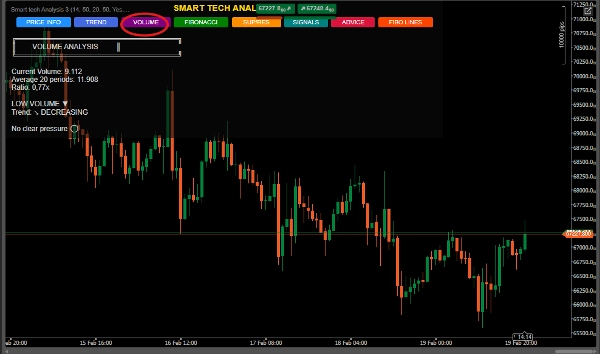
📊 4. ปริมาณพร้อมการอ่านสถาบัน
ระบบระบุ:
ปริมาณสูงสุด
แรงกดดันซื้อหรือขาย
การเร่งหรือชะลอตัว
เปรียบเทียบกับค่าเฉลี่ยในอดีต
👉 เหมาะสำหรับการตรวจจับกิจกรรมสถาบันที่เป็นไปได้
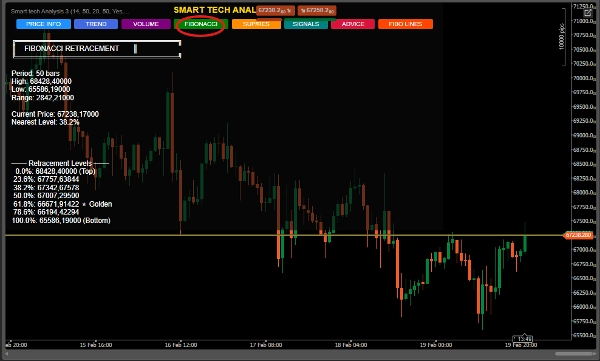
🧩 5. ฟีโบนักชีอัตโนมัติพร้อมโซนทองคำ
คำนวณแบบไดนามิกในช่วงเวลาที่กำหนด
เน้นพิเศษสำหรับ:
⭐ โซน 61.8% (โซนทองคำ)
📌 การระบุระดับที่ใกล้ที่สุด
📌 การขยายตัวแบบขาขึ้นและขาลง
📌 คำแนะนำตามบริบทอัตโนมัติ
เหมาะสำหรับเทรดเดอร์รีเทรซเมนต์และเทรดเดอร์สวิง
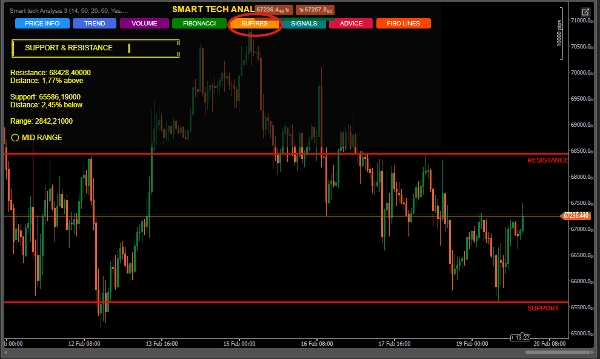
🛡 6. แนวรับและแนวต้านอัจฉริยะ
ตรวจจับจุดสูงและต่ำที่สำคัญ
แสดงระยะห่างเป็นเปอร์เซ็นต์จากราคาปัจจุบัน
จัดประเภทตำแหน่ง: ใกล้แนวรับ, แนวต้าน หรือช่วงกลาง
วาดเส้นอัตโนมัติบนแผนภูมิ
เหมาะสำหรับการเข้าสู่โซนเชิงกลยุทธ์
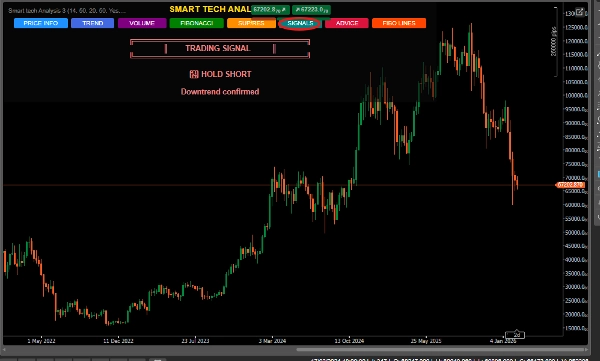
🚦 7. ระบบสัญญาณความสอดคล้อง
อัลกอริทึมไม่สร้างสัญญาณแบบสุ่ม
มันผสาน:
✔ การตัดกันของ EMA
✔ ความใกล้เคียงกับแนวรับ/แนวต้าน
✔ โครงสร้างแนวโน้ม
✔ บริบทของราคา
การจัดประเภท:
🟢 ซื้อแรง
🔴 ขายแรง
📈 ถือยาว
📉 ถือสั้น
⏸ รอ
พร้อมระดับความมั่นใจที่ระบุไว้
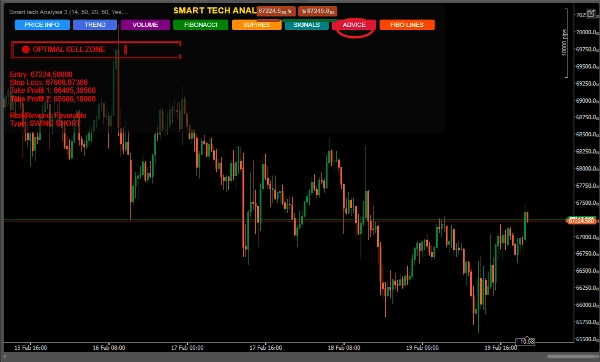
🎯 8. คำแนะนำพร้อมการจัดการความเสี่ยง
แผง "คำแนะนำ" ให้:
จุดเข้าซื้อที่แนะนำ
จุดหยุดขาดทุนทางเทคนิค
เป้าหมายทำกำไรสองระดับ
โครงสร้างสวิง (ยาวหรือสั้น)
บริบทการดำเนินงาน
👉 มันไม่ใช่แค่การวิเคราะห์
👉 มันคือแผนที่มีโครงสร้าง
🏆 ตัวบ่งชี้นี้เหมาะกับใคร?
✔ เทรดเดอร์มือใหม่ที่ต้องการความชัดเจน
✔ เทรดเดอร์ระดับกลางที่ต้องการความสอดคล้อง
✔ เทรดเดอร์ขั้นสูงที่แสวงหาประสิทธิภาพ
✔ เทรดเดอร์สวิง
✔ สแคปเปอร์ที่ใช้การยืนยันโครงสร้าง
💎 ทำไมมันโดดเด่นในตลาด? ตัวบ่งชี้ทั่วไป Smart Tech Analysis
ข้อมูลแยกส่วน การวิเคราะห์แบบบูรณาการ มลพิษทางสายตา แดชบอร์ดที่จัดระเบียบ ไม่มีบริบท การสอดคล้องทางเทคนิค ไม่มีการจัดการ จุดหยุดและเป้าหมายที่แนะนำ สัญญาณง่ายๆ สัญญาณพร้อมการยืนยัน
📊 ประโยชน์โดยตรง
✔ ลดการตัดสินใจที่อิงอารมณ์
✔ เพิ่มความแม่นยำ
✔ ปรับปรุงการอ่านโครงสร้าง
✔ ประหยัดเวลา
✔ ยกระดับมาตรฐานมืออาชีพของเทรดเดอร์
🧠 การวางตำแหน่งในตลาด
Smart Tech Analysis เหมาะสำหรับ:
ตลาดฟอเร็กซ์
ดัชนี
สินค้าโภคภัณฑ์
สกุลเงินดิจิทัล


