คำอธิบาย
ตัวชี้วัด Pinescriptlabs Store: 🤖Pinescriptlabs Store cBots : (cBot) Gold & BTC BreakoutSession Pivots(ใหม่)
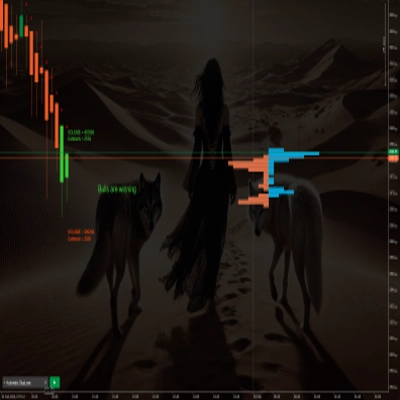
Prediction Based on Linreg & ATR
SmartTrend Support &
Resistance
Lines
Dynamic
Market Structure
Analysis
of
Turning
Points
Fibonacci
Linear
Regression
Multi-timeframe
Multi-Level
Candle Bias
Tracker
Auto
Support and
Resistance
Trend
Lines
All
Support and
Resistance
Levels
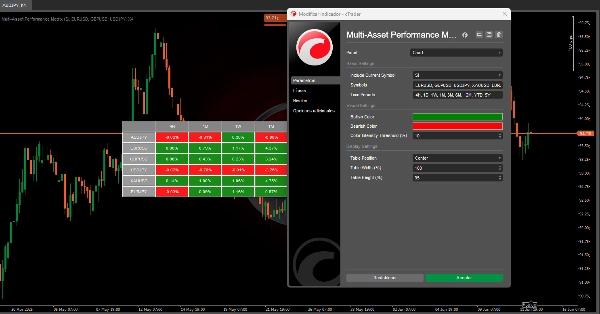
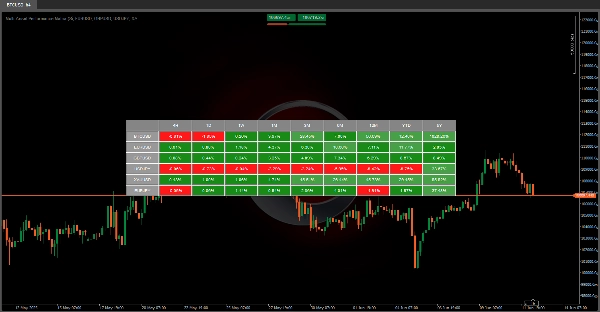
🚀 เมทริกซ์ประสิทธิภาพสินทรัพย์หลายประเภท 🚀
อัลกอริทึมนี้เป็น เครื่องมือแสดงผลภาพที่ทรงพลัง 📊 ออกแบบมาเพื่อแสดง เปอร์เซ็นต์ประสิทธิภาพ ของเครื่องมือทางการเงินหลายรายการในช่วงเวลาต่าง ๆ
มันเปลี่ยนข้อมูล ประวัติศาสตร์ ให้เป็น การแสดงผลที่มีประสิทธิภาพและเข้าใจง่าย ช่วยให้ผู้ใช้ประเมินพฤติกรรมของสินทรัพย์ทางการเงินต่าง ๆ ได้อย่างรวดเร็ว
❓ เครื่องมือนี้ทำอะไร?
1️⃣ 📈 เปรียบเทียบสินทรัพย์: แสดงให้เห็นว่าราคาของเครื่องมือทางการเงินต่าง ๆ (เช่น BTCUSD, EURUSD, XAUUSD เป็นต้น) เปลี่ยนแปลงอย่างไรตามเวลา
- ช่วงเวลา: D (รายวัน) | 1W (รายสัปดาห์) | 1M (รายเดือน) | 3M (รายไตรมาส) | 6M (รายครึ่งปี) | 12M (รายปี) | YTD (ตั้งแต่ต้นปี) | 5Y (5 ปีที่ผ่านมา)
2️⃣ 🎨 เน้นแนวโน้ม: ใช้ การระบายสี (🟢, 🔴 ) เพื่อระบุทันทีว่าสินทรัพย์ใดกำลังเพิ่มขึ้นหรือลดลงในแต่ละช่วงเวลา
3️⃣ ⏱️ อัปเดตอัตโนมัติ: รีเฟรชข้อมูล ทุกนาที เพื่อสะท้อนข้อมูลตลาดล่าสุด
💡 ทำไมถึงมีประโยชน์?
✔ 📊 การวิเคราะห์เปรียบเทียบ: ช่วยให้เปรียบเทียบสินทรัพย์หลายรายการเคียงข้างกัน—เหมาะสำหรับ การจัดการพอร์ตโฟลิโอ หรือการเลือกสินทรัพย์ที่มีประสิทธิภาพสูงสุดตามช่วงเวลา
✔ 🛡️ การควบคุม: การประเมินความ สม่ำเสมอ (หรือความผันผวน) ของสินทรัพย์ในช่วงเวลาต่าง ๆ ช่วยประเมิน ความเสี่ยงที่เกี่ยวข้อง.
✨ กุญแจสำคัญ
✅ ⏳ ประหยัดเวลา: การรวบรวมและคำนวณข้อมูลนี้ด้วยตนเองจะใช้เวลาหลาย ชั่วโมง—แต่เครื่องมือนี้ทำได้ทันที!
✅ 👀 ชัดเจนด้วยภาพ: ระบบ การระบายสี ทำให้การวิเคราะห์ง่าย แม้สำหรับ ผู้ใช้ที่ไม่เชี่ยวชาญทางเทคนิค.
✅ 🔄 ปรับตัวได้: รองรับ สัญลักษณ์ที่กำหนดเอง เพื่อให้คุณติดตามสินทรัพย์ที่สำคัญสำหรับคุณ
สรุป
รีวิวจากลูกค้า
5 | 100 % | |
4 | 0 % | |
3 | 0 % | |
2 | 0 % | |
1 | 0 % |