Descripción
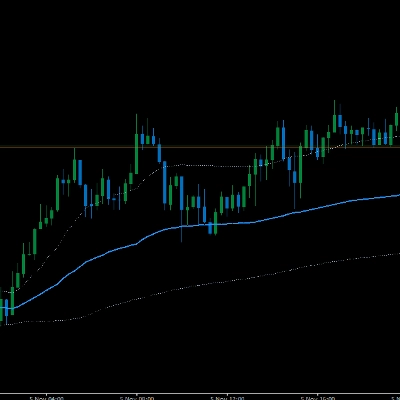
VWAP de nivel profesional que siempre calcula con datos de M1—sin importar en qué gráfico estés—trazando anclas Diarias, Semanales y Mensuales simultáneamente con bandas opcionales y colores y grosor totalmente editables.
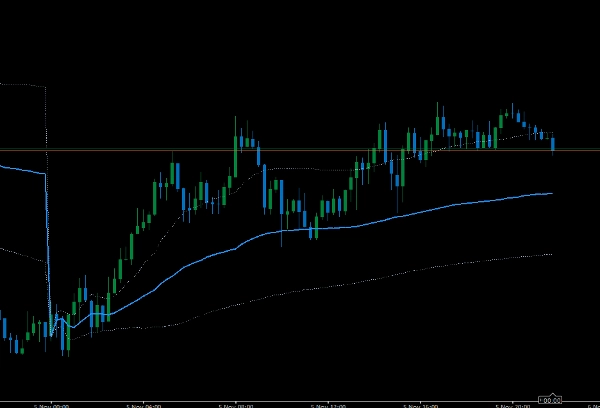
Compatible con gráficos Renko y Heikin Ashi
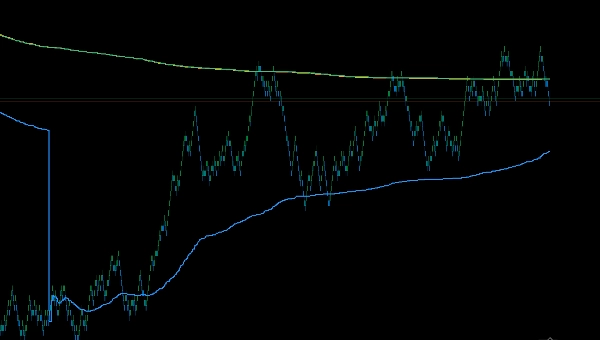
VWAP Multi-Anclado (Motor M1)
Un VWAP de precisión diseñado para traders que exigen anclajes exactos y visuales claros. El indicador utiliza internamente barras de 1 minuto para sus cálculos, por lo que puedes ver o operar en cualquier marco temporal o tipo de gráfico (tiempo, tick, rango, Renko, Heikin-Ashi)—tus VWAPs permanecen consistentes.
Características clave
- Verdadero motor VWAP M1: cálculos basados en datos de 1 minuto para resultados consistentes en todos los gráficos.
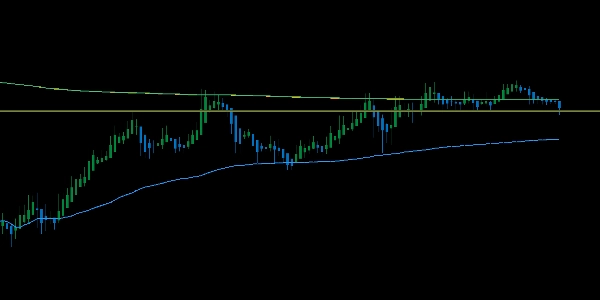
- 3 anclas a la vez: Diaria, Semanal, Mensual—perfecto para niveles institucionales y confluencia multi-marco.
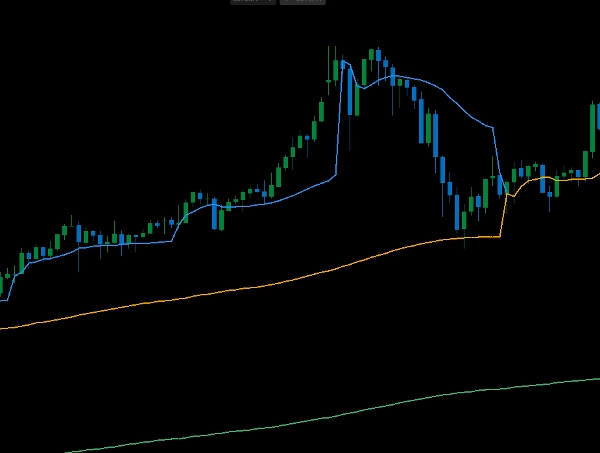
- Bandas activables por ancla: activa o desactiva bandas y ajusta un multiplicador por marco temporal (0 = ocultar).
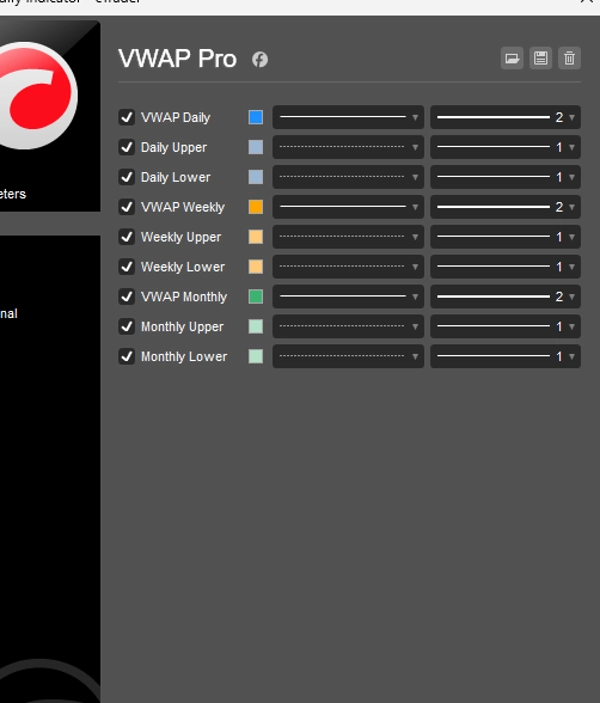
- Estiliza tus líneas: edita color y grosor para cada VWAP directamente en la configuración del indicador.
- Reinicios inteligentes: límites automáticos diarios/semanales/mensuales (ISO/semana que inicia lunes), sin necesidad de ajustes manuales.
- Ligero: matemáticas acumulativas optimizadas; mínimo uso de CPU.
Por qué te gustará
- Opera cualquier gráfico/marco temporal sin deriva del VWAP.
- Visualiza áreas de valor de marcos temporales superiores de un vistazo.
- Aspecto limpio y configurable que se adapta a tu plantilla.
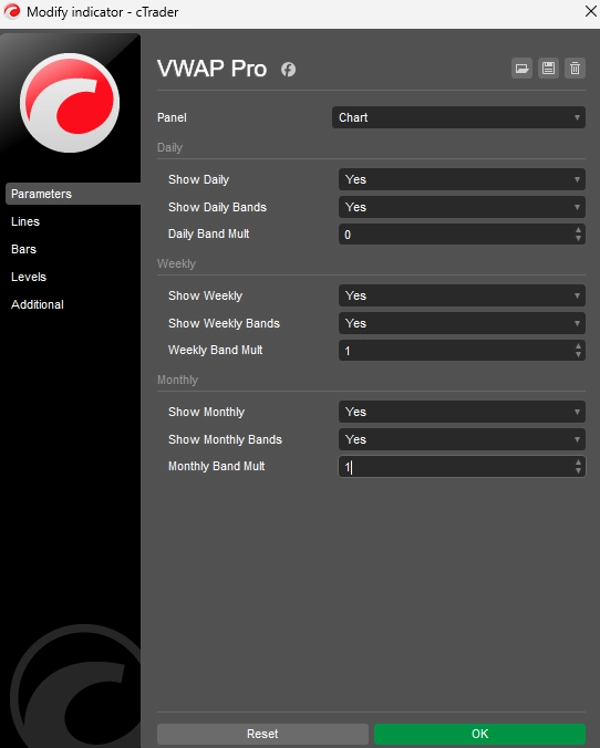
Entradas (rápidas)
- Visibilidad: Mostrar Diaria / Semanal / Mensual
- Bandas: Mostrar Bandas Diarias/Semanales/Mensuales, Multiplicador de Banda por ancla
- Estilo: por ancla color y grosor (a través de estilos de salida)
Notas
- Requiere historial M1 del bróker; las primeras barras pueden mostrar
NaNhasta que se cargue suficiente data M1. - Usa ponderación de TickVolume (disponible universalmente en símbolos cTrader).
Ideal para
Scalpers, traders intradía y swing que alinean entradas con VWAP de sesión/día/semana/mes y bandas de desviación estándar.
Esto no es un consejo financiero, es un indicador personalizado que uso y creo que podría ser útil para alguien más.
Tus resultados son tu responsabilidad.
Resumen
Valoraciones de clientes
5 | 0 % | |
4 | 100 % | |
3 | 0 % | |
2 | 0 % | |
1 | 0 % |


