คำอธิบาย
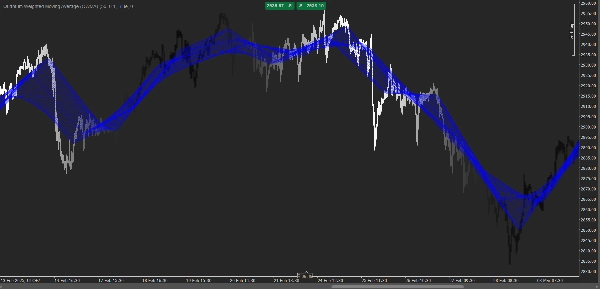
Quantum Weighted Moving Average (QWMA)
The Quantum Weighted Moving Average (QWMA) เป็นตัวบ่งชี้การซื้อขายขั้นสูงที่ออกแบบมาเพื่อปรับน้ำหนักของราคาที่ผ่านมาอย่างไดนามิกตามสภาพตลาด แตกต่างจากค่าเฉลี่ยเคลื่อนที่แบบดั้งเดิมที่ใช้ค่าน้ำหนักคงที่ QWMA ใช้ฟังก์ชันการลดทอนแบบเลขชี้กำลังที่ปรับตัวได้เพื่อกำหนดความสำคัญมากขึ้นกับการเคลื่อนไหวของราคาล่าสุดในขณะที่ยังคำนึงถึงข้อมูลในอดีต
คุณสมบัติหลัก:
✅ Adaptive Weighting: ปรับอิทธิพลของราคาที่ผ่านมาโดยอิงจากความผันผวนและความแข็งแกร่งของแนวโน้ม
✅ Enhanced Sensitivity: ตอบสนองต่อการเปลี่ยนแปลงของราคาได้รวดเร็วกว่า ค่าเฉลี่ยเคลื่อนที่แบบง่ายและแบบเลขชี้กำลัง
✅ Noise Reduction: ช่วยกรองเสียงรบกวนของตลาดในขณะที่ยังคงความชัดเจนของแนวโน้ม
✅ Customizable Parameters: อนุญาตให้ผู้ซื้อขายปรับเปลี่ยนปัจจัยการลดทอนและฟังก์ชันน้ำหนักให้เหมาะสมกับกลยุทธ์การซื้อขายที่แตกต่างกัน
วิธีการทำงาน:
QWMA ใช้ฟังก์ชันการลดทอนแบบเลขชี้กำลังกับข้อมูลราคาที่ผ่านมา เพื่อให้แน่ใจว่าราคาที่เก่ากว่าจะมีอิทธิพลลดลงในขณะที่ค่าล่าสุดมีส่วนร่วมมากขึ้น ส่งผลให้เส้นแนวโน้มที่เรียบขึ้นแต่ตอบสนองได้ดีขึ้นซึ่งปรับตัวเข้ากับพลวัตของตลาดที่เปลี่ยนแปลง
เหมาะสำหรับ:
📈 ผู้ติดตามแนวโน้ม – ระบุแนวโน้มที่แข็งแกร่งด้วยความล่าช้าน้อยที่สุด
📉 ผู้ซื้อขายสวิง – ตรวจจับการกลับตัวของตลาดได้เร็วกว่าค่าเฉลี่ยเคลื่อนที่มาตรฐาน
💹 นักเก็งกำไรระยะสั้น – ได้รับข้อมูลเชิงลึกอย่างรวดเร็วเกี่ยวกับการเปลี่ยนแปลงโมเมนตัมระยะสั้น
QWMA เป็นเครื่องมือที่ทรงพลังสำหรับผู้ซื้อขายที่ต้องการความสมดุลระหว่าง ความเรียบเนียนและการตอบสนอง ทำให้เหมาะสำหรับตลาดการเงินหลากหลายประเภท รวมถึง หุ้น ฟอเร็กซ์ และการซื้อขายคริปโต 🚀
สรุป
รีวิวจากลูกค้า
5 | 0 % | |
4 | 100 % | |
3 | 0 % | |
2 | 0 % | |
1 | 0 % |