
说明
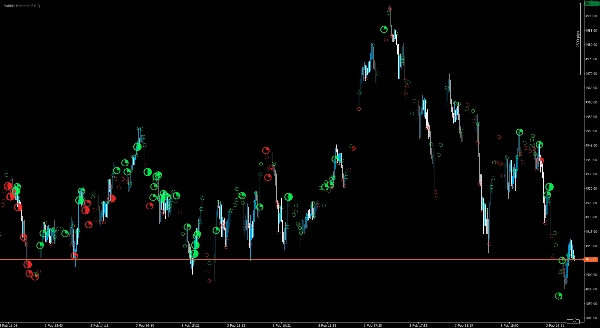
Delta Peak Bubbles 是为希望在逐笔图上快速、直观地识别“市场工作所在位置”的交易者打造的。它没有用额外的面板来占用屏幕空间,而是直接在图表上绘制清晰、分级的气泡,以实时揭示高强度的活动爆发。
该指标聚焦于每根K线中的峰值时刻,并通过易于阅读的强度刻度进行可视化(从细微的圆圈到最强事件的显眼星形)。气泡采用颜色编码,快速提供方向性背景,使您一眼即可区分多头与空头压力。
Delta Peak Bubbles 针对实用的交易工作流程设计,特别适用于:
- 剥头皮和短期动量交易
- 突破确认和冲击跟踪
- 识别反应区和潜在的耗尽点
- 为价格行为 / SMC / 关键水平策略添加“热度层”
气泡强度指南
气泡分为四个强度等级,帮助您快速区分正常活动与高影响力的峰值:
- 等级 1 – 低:
○(轻微峰值) - 等级 2 – 中:
◔(中等峰值) - 等级 3 – 高:
◑(强烈峰值) - 等级 4 – 极端:
★(非常强烈 / 突出峰值)
颜色表示方向性压力(绿色 = 多头,红色 = 空头)。
显示控制使其在任何布局上都保持清晰,包括4K显示器,因此您可以保持图表的可读性,同时看到重要时刻。
免责声明: 交易/投资涉及重大风险,可能导致全部投资资本的损失。该指标仅供信息和分析用途,不构成财务建议、要约或推荐。使用风险自负;您对所有交易决策和结果负全责。提供者不对准确性、完整性、及时性、性能、适销性或特定用途适用性作出任何明示或暗示的陈述或保证。在法律允许的最大范围内,提供者不对因使用该指标而产生或与之相关的任何直接或间接损失、损害或利润损失承担责任(包括但不限于因市场状况、数据/平台问题、配置错误或误用导致的损失)。过去的表现并不代表未来结果的可靠指标。
摘要
AI 摘要
Bubble Indicator 2.0 is a tick-chart overlay indicator designed for the cTrader platform that visually highlights strong momentum spikes in real time. It displays graded bubbles directly on tick charts to indicate peak moments of market activity, using a four-level strength scale from minor (Level 1) to extreme spikes (Level 4). The bubbles are color-coded—green for bullish pressure and red for bearish—to provide immediate directional context. This indicator is suited for scalping, short-term momentum trading, breakout confirmation, impulse tracking, identifying reaction zones, and enhancing price action or smart money concept strategies. Display controls ensure clarity on various screen layouts, including 4K monitors, by keeping the chart readable while emphasizing significant market moves.
指标配置
客户评价
4.3
评价:3
5 | 33 % | |
4 | 67 % | |
3 | 0 % | |
2 | 0 % | |
1 | 0 % |
客户评价
February 6, 2026
Calm decision layer for traders who combine signals before acting. It gives value around chart reading, but it should not be used as a blind entry trigger. The cleaner reads should hold across 3 sessions, not just 1 good chart. It is stronger when a 1.5R target is realistic before the entry.
February 5, 2026
February 5, 2026
Measured chart review for chart reading. it makes market context easier to scan, especially when used for adding confirmation before a trade. I would test it on 2 timeframes, 20 signals and a 1R stop plan. It is stronger when a 1.5R target is realistic before the entry.
讨论
常见问答
Breakout
Scalping
SMC
cTrader Store 提供的所有产品,包括交易机器人、指标和插件,均由第三方开发者提供,仅供信息参考和技术访问之用。cTrader Store 并非经纪商,不提供投资建议、个人推荐或任何未来业绩保证。
!["Wyckoff Toolkit [Iridio Capital]" 标识](https://cdn.ctrader.com/image/webp/8acfe6a1-6a8e-4578-9367-9df3af2b1801_27763)


价格
注册日期 10/01/2026
6
销售