Descripción
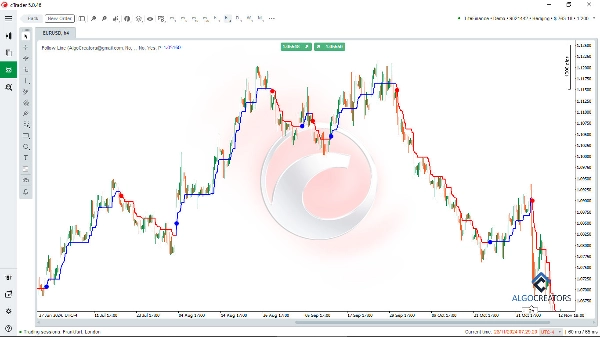
El indicador Follow Line es un potente indicador de cTrader para análisis técnico, que ayuda a los traders a identificar puntos óptimos de entrada y salida en los mercados financieros. Al combinar las Bandas de Bollinger y el indicador ATR, filtra las tendencias y proporciona señales confiables de compra y venta.
Con este indicador, puedes detectar fácilmente tendencias de mercado alcistas o bajistas y seguir señales de alta confianza.
Los traders pueden combinar el Indicador Follow Line con herramientas avanzadas como el indicador Smart Money Assistant de cTrader y osciladores como el MACD para mejorar su análisis y confirmar las entradas de operaciones.
Sus configuraciones personalizables y alertas en tiempo real lo convierten en una valiosa adición a cualquier estrategia de trading, permitiendo a los usuarios ejecutar operaciones exitosas con confianza y precisión.
Características clave:
- Detección de tendencias: Usa el Follow Line para identificar tendencias de mercado alcistas o bajistas.
- Señales de compra/venta: Muestra señales precisas de compra y venta basadas en rupturas de las Bandas de Bollinger.
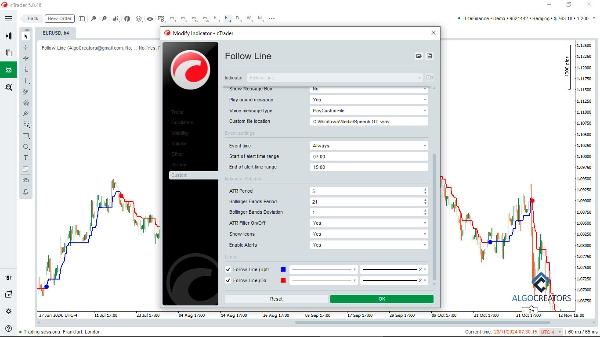
- Filtro ATR: Opción para activar o desactivar el filtro ATR para mejorar la precisión de las señales.
- Configuraciones personalizables: Ajusta el período de las Bandas de Bollinger, la desviación estándar y el período del ATR.
- Representación visual: Muestra señales en el gráfico usando íconos intuitivos (flechas o líneas).
- Alertas: Recibe alertas instantáneas cada vez que aparece una señal de compra o venta.
Este indicador es altamente personalizable, permitiendo a los traders ajustar los períodos de las Bandas de Bollinger, desviaciones estándar y configuraciones del ATR para adaptarse a su estrategia. Las señales visuales y las alertas instantáneas lo hacen fácil de usar y efectivo tanto para scalping como para swing trading. Con características como detección de tendencias, gestión de riesgos y configuraciones personalizables, el Indicador Follow Line es ideal para traders de forex, criptomonedas y acciones que buscan mejorar su análisis técnico y rendimiento en el trading.
¡Perfecto para identificar oportunidades precisas en el mercado!
Resumen
Users can customize settings such as Bollinger Bands period, standard deviation, and ATR period to align with their trading strategies. The indicator visually represents signals on the chart using intuitive icons like arrows or lines and provides real-time alerts when signals occur. It supports various trading styles, including scalping and swing trading, and is suitable for forex, cryptocurrency, and stock markets.
The Follow Line indicator can be combined with other tools like the cTrader Smart Money Assistant and MACD oscillators to confirm trade entries and enhance analysis. Its customizable features and alert system assist traders in identifying precise market opportunities and managing risk effectively.
Valoraciones de clientes
5 | 60 % | |
4 | 20 % | |
3 | 20 % | |
2 | 0 % | |
1 | 0 % |


![Logotipo de "[Hamster-Coder] Bollinger Bands"](https://cdn.ctrader.com/image/webp/21d8e5d6-fb11-4bac-b9ee-cd05c2b76804_30327)