
Descripción
🚀 Más de 10,000 traders ya usan nuestros PRINCIPALES indicadores🏆
Descubre por qué los profesionales nos eligen: las herramientas más poderosas en cTrader (indicadores, algoritmos y cBots) te están esperando.
👉 Obtén todos nuestros sistemas TOP aquí:
_______________________________________________
📌 Indicadores de Estructura de Mercado
· ✅ AdvancedMarket Structure: Bos, Choch, SwinLevels, Order Blocks, Market Structure& Liquidity Finder
· 🔄 Análisis Dinámico de Estructura de Mercado de Puntos de Giro
· 🧱 Bloque de Orden
· ⛓️ BOS & CHOCH
· 🧠 ICT Poder de 3
· 🌀 Zonas de Polaridad de Mercado
_______________________________________________
🔚 Sistemas Inteligentes de Salida
· 📍 Algoritmo Inteligente de Seguimiento
_______________________________________________
📐 Indicadores ZigZag
· 🔍 Proyección de Liquidez de Precio ZigZag
· ➖ ZigZag
· 🎯 Rastreador de Extremos Zig-Zag
_______________________________________________
🧱 Indicadores de Soporte y Resistencia
· 🟩 Líneas de Soporte y Resistencia SmartTrend
· 🧱 Todos los Niveles de Soporte y Resistencia
_______________________________________________
📊 Indicadores de Tendencia y Canal
· 🔄 Canal de Tendencia Automático
· 📊 Supertrend
· ⚡Analizador de Tendencia Momentum
· 🧠 Canal de Tendencia Adaptativo
· 💥 Sistema de Ruptura de Canal
· 🌈 Gradiente Dinámico de Tendencia
_______________________________________________
💧 Herramientas de Volumen y Liquidez
· 🔥 Mapa de Calor POC de Volumen
· 📉 Mapa de Liquidación de Apalancamiento
· 🔍 Brecha de Valor Justo Momentum
· 🕒 Sesiones de Brecha de Valor Justo
_______________________________________________
⚡ Indicadores de Momentum y RSI
· 📈 Disparador de Tendencia RSI
· 🚀 Momentum de Rango Dinámico
· 🔎 Sesgo de Vela Multi-Nivel
Rastreador
_______________________________________________
🔮 Herramientas de Predicción y Proyección
· 📐 Predicción Basada en Linreg& ATR
· 📏 Regresión Lineal FibonacciMulti-marco temporal
· 📈 Proyector de Flujo de Mercado Potenciado por Volumen
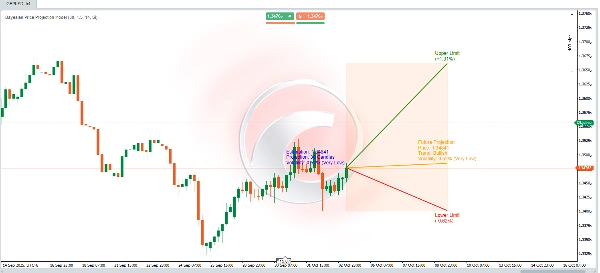
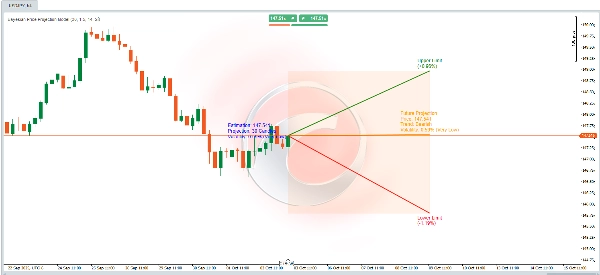
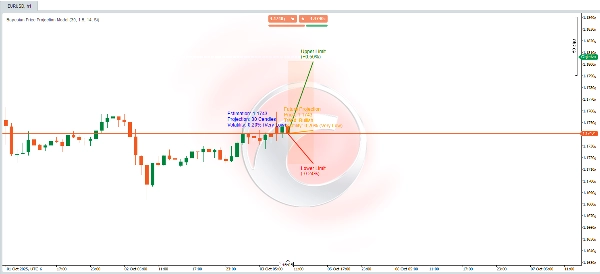
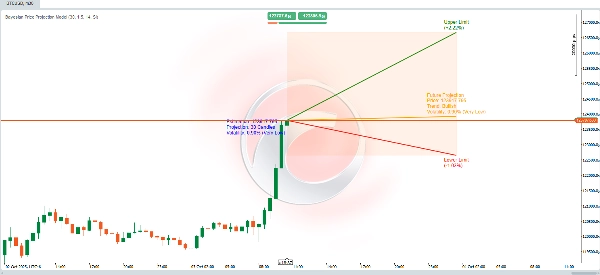
📊 Algoritmo Dinámico de Proyección de Precio 📈
Este algoritmo combina **cálculos estadísticos**, **análisis técnico** y **teoría bayesiana** para pronosticar un precio futuro mientras proporciona **rangos de incertidumbre** que representan límites superiores e inferiores. Los cálculos están diseñados para ajustar las proyecciones considerando las **tendencias** del mercado, la **volatilidad** y las probabilidades históricas de alcanzar nuevos máximos o mínimos.
Así es como funciona:
🚀 Proyección de Precio Futuro
Un cálculo dinámico estima el precio futuro basado en tres elementos clave:
1. **Tendencia**: Define si el mercado está predispuesto a subir o bajar.
2. **Volatilidad**: Cuantifica la magnitud del cambio esperado basado en fluctuaciones históricas.
🧠 **Ajuste Probabilístico Bayesiano**
- Las probabilidades condicionales se calculan usando la **fórmula de Bayes**:
\[
P(A|B) = \frac{P(B|A) \cdot P(A)}{P(B)}
\]
Esto modela eventos futuros usando información condicional:
- **Probabilidad de alcanzar un nuevo máximo histórico** si el precio está en tendencia alcista.
- **Probabilidad de alcanzar un nuevo mínimo histórico** si el precio está en tendencia bajista.
- Estas probabilidades refinan la estimación del precio futuro considerando:
- **Mayor volatilidad** aumenta la probabilidad de alcanzar niveles extremos (máximos/mínimos).
- **Las tendencias del mercado** influyen en la dirección esperada del movimiento del precio.
🌟 **Cálculo de Volatilidad**
- La volatilidad se mide usando el indicador **ATR (Rango Verdadero Promedio)** con una ventana de 14 períodos. Esto refleja la amplitud promedio de las fluctuaciones de precio.
- Para expresar la volatilidad como porcentaje, el ATR se normaliza dividiéndolo por el precio de cierre y multiplicándolo por 200.
- Luego, la volatilidad se categoriza en niveles descriptivos (por ejemplo, **Muy Baja**, **Baja**, **Moderada**, etc.) para una mejor interpretación.
---
🎯 **Límites de Desviación (Superior e Inferior)**
- Los límites superior e inferior forman un **rango proyectado** alrededor del precio futuro estimado, proporcionando un marco para la incertidumbre.
- Estos límites se calculan ajustando el ATR usando:
- Un **multiplicador** definido por el usuario (`factor_desviacion`).
- Las **probabilidades bayesianas** calculadas anteriormente.
- La **raíz cuadrada del período proyectado** (`proyeccion_dias`), incorporando el principio de que la incertidumbre crece con el tiempo.
🔍 **Interpretando el Modelo**
Esto puede verse como un **modelo probabilístico dinámico** que:
- Combina **análisis técnico** (tendencias y ATR).
- Refina probabilidades usando **teoría bayesiana**.
- Proporciona un **rango de proyección visual** para ayudarte a entender los posibles movimientos futuros del precio y las incertidumbres asociadas.
⚡ Ya sea que estés analizando **mercados volátiles** o confirmando **escenarios alcistas/bajistas**, esta herramienta te equipa con un enfoque robusto basado en datos! 🚀


