説明
🚀 10,000人以上のトレーダーがすでに私たちのTOP インジケーター🏆
なぜプロが私たちを選ぶのかを発見してください – cTrader上で最も強力なツール(インジケーター、アルゴリズム、cBots)があなたを待っています。
👉 すべてのTOPシステムはこちらから入手できます:
_______________________________________________
📌 マーケット構造インジケーター
· ✅ AdvancedMarket Structure: Bos, Choch, SwinLevels, Order Blocks, Market Structure&流動性ファインダー
· 🔄 ダイナミックマーケット構造 ターニングポイントの分析
· 🧱 オーダーブロック
· ⚖️ マーケットアンバランス
· ⛓️ BOS&CHOCH
· 🧠 ICTパワーオブ3
· 🌀 マーケットポラリティゾーン
_______________________________________________
🔚 スマートエグジットシステム
· 📍 トレーリングスマートアルゴリズム
_______________________________________________
📐 ジグザグインジケーター
· 🔍 ジグザグ価格流動性予測
· 🧭 S&R構造ジグザグ
· ➖ ジグザグ
· 🎯 ジグザグ極端トラッカー
_______________________________________________
🧱 サポート&レジスタンスインジケーター
_______________________________________________
📊 トレンド&チャネルインジケーター
· 🔄 オートトレンドチャネル
· 📊 スーパートレンド
· 🧠 アダプティブトレンドチャネル
· 💥 チャネルブレイクアウトシステム
· ⭐ プレミアムSSLチャネル
· 🔁 リアクティブ移動平均
_______________________________________________
💧 ボリューム&流動性ツール
· 🔥 ボリュームPOCヒートマップ
· 📉 レバレッジ清算マップ
· 🔍 モメンタムフェアバリューギャップ
· 🕒 フェアバリューギャップセッション
_______________________________________________
⚡ モメンタム&RSIインジケーター
· 📈 RSIトレンドトリガー
· 🚀 ダイナミックレンジモメンタム
_______________________________________________
🔮 予測&投影ツール
· 📐 Linreg&ATRに基づく予測
________________________________________________________________________________________________________
________________________________________________________________________________________________________
マクドナルドパターンベジェ曲線 🍟
これは何のため? 🤔
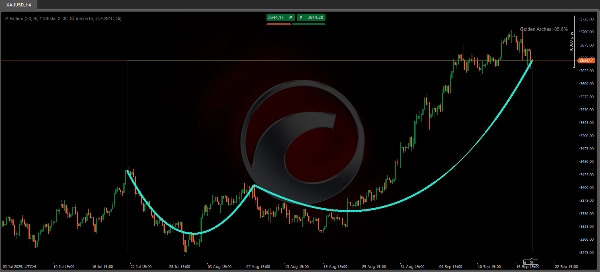
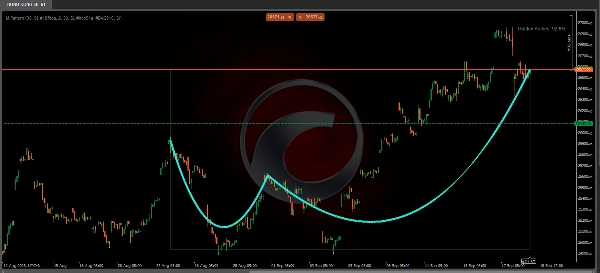
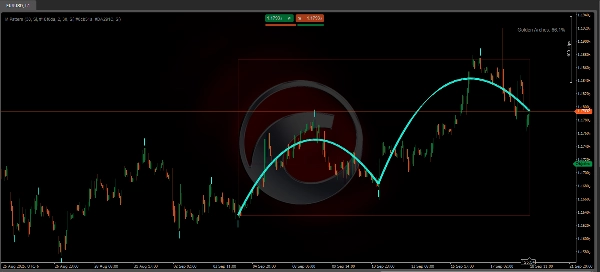
この 「マクドナルドパターンベジェ曲線」 インジケーターは、ベジェ曲線を使用して価格反転パターンを識別および視覚化するように設計されています。主な目的は、チャート上で弧のような市場構造(「M」または「W」に似たもの)を検出し、潜在的なトレンド変化を示唆することです🎯。さらに、検出されたパターンの品質を評価するためのスコアリングシステムも含まれています。
どのように機能しますか? ⚙️
- ピボット検出:
インジケーターは、指定された 「ルックバック期間」内で局所的な高値と安値(ピボット)を識別します。これらはチャート上に円でマークされます:⚪ - ベジェ曲線:
少なくとも 5つのピボットが検出されると、インジケーターはこれらの点を結ぶ2つの弧をベジェ曲線で描画します。これらの弧はピボット間の移行を滑らかにし、双子のアーチ(「ゴールデンアーチ」)のような視覚構造を形成することを目的としています🏛️。 - 色付きゾーン:
有効にすると、最初と最後のピボット間に領域が描かれます。このゾーンの色はパターンの方向によって決まります: -
- 🟢 緑:強気トレンド(最後のピボットが高い場合)。
- 🔴 赤:弱気トレンド(最後のピボットが低い場合)。
- パターンスコア:
弧の対称性と品質を反映するパーセンテージを計算します。スコアが高いほど、より明確なパターンを示唆します。
再描画(リプロット)しますか? 🔄
はい、このインジケーターは再描画します。これは、新しい価格データが取得されると、その描画や検出が遡及的に変わる可能性があることを意味します。これは、潜在的なピボットの形成後に一定数のバーを観察してその転換点を特定するためです。したがって、過去のデータで確認されたように見える弧が、ライブチャート📊に適用すると調整されたり消えたりすることがあります。
これはテクニカル分析の補助として使用できます。
どのように使えますか? 💡
- 📚 バックテスト分析:
過去のパターンを研究し、異なる資産や時間枠での効果を評価するのに役立ちます。 - 👁️ 視覚的確認:
他の分析ツール(サポート/レジスタンスや移動平均など)を補完して、潜在的な反転を検証できます。 - 🎓 教育:
ベジェ曲線に基づく市場構造の認識を助けますが、ライブトレードでの使用には追加の検証が必要です。
制限と推奨事項 ⚠️
- リアルタイム使用:
再描画するため、独立したシグナルとしての使用は避けるべきです。市場のエントリーやエグジットに単独で使わないでください。 - 最適化:
資産や時間枠に応じて「ルックバック期間」を調整し、誤シグナルを減らしてください。 - 市場コンテキスト:
トレンド市場で最も効果的であり、横ばい/レンジ市場では効果が低いです。
重要な注意事項:🚨
将来のデータに依存して確認を行うため、主にすでに発生したイベントの分析(市場オープン後の下落や教育的なチャート演習など)に使用し、予測やライブトレード目的には使用しないでください。そのアプローチは革新的ですが、再描画の性質による誤シグナルを避けるために他のインジケーターや分析と併用する必要があります。バックテスト研究やトレーディング戦略の教育的補完として理想的です。
概要
This tool repaints, meaning its visualizations and detections can change retroactively as new price data arrives, so it is best used for backtesting, educational purposes, or as a complementary aid alongside other technical analysis tools. It is optimized for trending markets and requires adjustment of the lookback period to suit different assets and timeframes. The indicator supports markets including Forex (e.g., EURUSD), commodities (e.g., XAUUSD), and cryptocurrencies (e.g., BTCUSD).