
Descrição
🏆 Mais de 10.000 Traders Confiam em Nossa Suíte de 25+ Algoritmos! 🏆
De Estrutura de Mercado & Liquidez até Sistemas Inteligentes de Saída & Ferramentas Preditivas - construímos TODAS as ferramentas que você precisa para consistência.
👉 Acesse Todos os 25+ Sistemas COMPROVADOS:
_______________________________________________
📌 Indicadores de Estrutura de Mercado
· 🔄 Análise Dinâmica da Estrutura de Mercado de Pontos de Virada
· 🧱 Bloco de Ordem
· ⛓️ BOS & CHOCH
· 🧠 ICT Poder do 3
· 🌀 Zonas de Polaridade de Mercado
_______________________________________________
🔚 Sistemas Inteligentes de Saída
· 📍 Algoritmo Inteligente de Trailing
_______________________________________________
📐 Indicadores ZigZag
· 🔍 Projeção de Liquidez de Preço ZigZag
· ➖ ZigZag
· 🎯 Rastreador de Extremos Zig-Zag
_______________________________________________
🧱 Indicadores de Suporte & Resistência
· 🟩 Linhas de Suporte & Resistência SmartTrend
· 🧱 Todos os Níveis de Suporte e Resistência
_______________________________________________
📊 Indicadores de Tendência & Canal
· 🔄 Canal de Tendência Automático
· 📊 Supertrend
· ⚡Analisador de Tendência Momentum
· 🧠 Canal de Tendência Adaptativo
· 💥 Sistema de Rompimento de Canal
· 🌈 Gradiente Dinâmico de Tendência
_______________________________________________
💧 Ferramentas de Volume & Liquidez
· 📉 Mapa de Liquidação de Alavancagem
· 🔍 Gap de Valor Justo Momentum
· 🕒 Sessões de Gap de Valor Justo
_______________________________________________
⚡ Indicadores de Momentum & RSI
· 🚀 Momentum de Alcance Dinâmico
· 🔎 Viés de Vela Multi-Nível
Rastreador
_______________________________________________
🔮 Ferramentas de Previsão & Projeção
· 📐 Previsão Baseada em Linreg& ATR
· 📏 Regressão Linear Fibonacci Multi-tempo
· 📈 Projetor de Fluxo de Mercado Alimentado por Volume_________________________
_________________________________________________________________________________________________
_________________________________________________________________________________________________
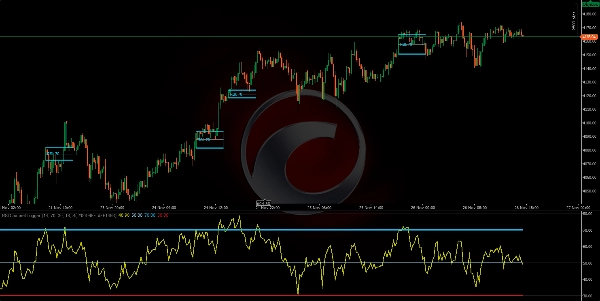
GATILHO DO CANAL RSI: 📶
O que é: Um indicador que calcula o RSI(período) e marca visualmente zonas de momentum quando o RSI cruza os limites de sobrecompra/sobrevenda (padrão 70/30). ✅
https://chartshots.spotware.com/c/69278f8b6d973
Lógica: Quando um limite é cruzado, ele cria uma "zona" baseada na máxima/mínima da vela no momento do cruzamento. Então: 🧠
- Colore as velas dentro dessa zona.
- Desenha um canal (máximo, mínimo, meio).
- Marca o cruzamento no painel RSI com um círculo e um rótulo.
A zona dura exatamente MinZoneDuration velas. ⏱️
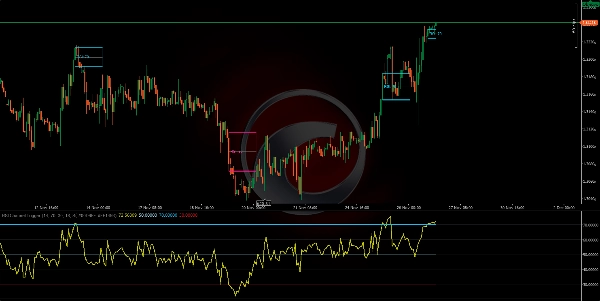
Sinais claros:
- Cruzamento acima de Sobrecompra → inicia uma zona de alta. 🟢
- Cruzamento abaixo de Sobrevenda → inicia uma zona de baixa. 🔴
A zona em si é uma área de interesse, não uma ordem.
https://chartshots.spotware.com/c/69278fb274e0b
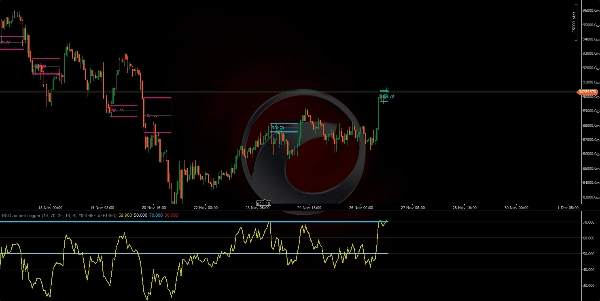
Como usar (rápido):
- Espere a zona se formar. 🎯
- Confirme com ação do preço (rompimento/rejeição das linhas do canal).
- Entre com um stop loss fora da zona e um alvo na linha do meio do canal ou uma razão Risco/Retorno definida.
https://chartshots.spotware.com/c/69278fe76237b
Parâmetros Chave: ⚙️
- Período RSI (14)
- Sobrecompra (70)
- Sobrevenda (30)
- MinZoneDuration (15)
- Cores configuráveis 🎨
Resumo
Clear signals include:
- RSI crossing above the overbought level, initiating a bullish momentum zone.
- RSI crossing below the oversold level, initiating a bearish momentum zone.
These zones serve as areas of interest rather than direct trade orders. Users can confirm signals with price action such as breakouts or rejections from channel lines and plan entries with stop losses placed outside the zone and targets at the mid-channel line or based on risk/reward ratios.
The indicator supports multiple markets and symbols including Forex pairs (EURUSD, GBPUSD, NZDUSD, USDJPY), commodities (XAUUSD), indices (NAS100), cryptocurrencies (BTCUSD), and stocks. It offers configurable parameters for RSI period, threshold levels, zone duration, and colors.


![Logótipo de "[Hamster-Coder] Moving Average"](https://cdn.ctrader.com/image/webp/1bd952ad-57d2-4db2-9b49-b01be0b048b8_30113)


